Subscribe to OW blog for an instantly better inbox
Oops! Something went wrong while submitting the form.
Articles and Podcasts on Customer Service, AI and Automation, Product, and more
.webp)
Nearly 18 years ago, Optimal helped define what UX research could be, pioneering practices and tools that would become industry standard and change how teams worldwide better understand their users. As the industry has evolved, so has Optimal, expanding the platform, advancing participant recruitment, and building Optimal Intelligence AI to accelerate insight to action.
Now, we’re at the edge of another major shift. With the launch of the Model Context Protocol (MCP), we’re entering a new realm, moving from traditional research workflows to AI-powered intelligence.
Research data is one of the most valuable assets in any organization, but until now, it has been scattered across studies and reports, time-consuming to search and synthesize, and different to search or reuse. MCP now changes that for research teams.
Model Context Protocol (MCP) enables you to connect your Optimal research directly to AI tools, like ChatGPT, Claude, or Cursor, to explore and analyze your data seamlessly. Insights can go beyond data downloads, dashboards, or static reports. Access your insights and explore further with natural conversation.
Get instant insights for questions like:
With MCP-connected tools, you can:
The evolution is clear.
We started by helping teams understand users through early UX research methods.
We helped formalize how research is conducted, analyzed, and shared.
And now, with MCP in Optimal, we’re helping teams move beyond analysis altogether toward conversational, AI-driven research intelligence.
Log in to Optimal, connect with your AI tools, and get the most value from your research or book a demo to start building your research repository with Optimal.
Time, money, people, access, reach. The resources we have at our disposal can also become constraints. In the real world, research projects don’t always follow a perfect plan. There are times when we have to be pragmatic and work with what we have, but there are limits. Knowing where those limits are and when to push back can be really challenging. If we don’t push back in the right way, our research results and design decisions could be compromised and if we push back in the wrong way, we may be inviting a whole host of new resourcing constraints that might just make life harder for us.
Let’s take a look at some research approach compromises that you should push back on, some examples of useful workarounds that will still allow you to gain the insights you need for your project and some constructive ways to lead those push back conversations.
We know we’re not our users and this is definitely one of those moments where we have a responsibility to speak up and try to find a better way. Experts and frontline staff who interact with users or customers all day long certainly have a lot of value to contribute to the design process, however you really do need to gather insights from the people you’re designing for. Failing to include users or customers in your research has a high likelihood of coming back to bite you in the form of poorly designed products, services and experiences that will need to be redesigned costing you more time and money. If you do happen to get away with it and produce something that is fit for purpose, it’s because you were lucky. Don’t base your design decisions on luck and don’t let your stakeholders and team do it either.
Focus groups are a pain for a number of reasons, but one of the biggest issues is that the information that you’ll gather through them more often than not lacks depth, context and sometimes even authenticity. When you bring a group of people together into a room, instead of useful and useable insights, you’re more likely to end up with a pile of not-so-helpful opinions and you open your research up to a delightful thing called groupthink where your participants may say they agree with something when they actually don’t. Also, the things that people say they do in a focus group might not align to what they actually do in reality. It’s not their fault – they most likely think they’re being helpful but they’re really just giving you a bunch data you can’t be sure of.
There’s a time and a place for when a survey might be appropriate, but a standalone research study isn’t it. A survey on its own isn’t enough to gain an appropriate level of depth to inform complex design decisions – it’s more of a starting point or a study to complement a round of user interviews. Surveys don’t allow you to dig deeper into participant responses – you can’t ask follow up questions in that moment and keep asking questions until you get the insight you need. You also don’t know what they’re doing or where they are when they complete your survey. You have no context or control over their environment – they might not complete the whole thing in one sitting and may leave it open on their device while they go off and complete other non-survey related tasks.
Surveys function best when they’re brief and don’t take up too much of your participant’s time because if they’re too long or require in-depth detail to be shared, people might just start providing quick or less than helpful responses just to get through it and finish. If there’s an incentive on offer, you also run the risk of participants providing nonsense responses just to complete the study to obtain the reward or they might just tell you what they think you want to hear so they don’t miss out.
Skipping this very important early step in the design process in the hopes of saving time or money can end up being quite costly. If you launch into the design stage of a new product or a major redesign of an existing product without conducting UX research upfront, you’ll likely end up designing something that isn’t needed, wanted or fit for purpose. When this happens, all that time and money you apparently ‘saved’ – and then some – will get spent anyway trying to clean up the mess like I mentioned earlier. Start your design journey out on the right foot and work with your team and stakeholders to find a way to not skip this critical piece of research.
If you have to choose between talking to 5 users or customers or no one at all, always pick the former. Talking to a smaller group is far better than talking to absolutely no one and essentially designing off your and your team’s opinion and not much else. Research is scalable. You don’t have to run 20+ user interviews to gather useful and deep insights – in many cases patterns tend to appear around the 5-10 participants mark. You can run your research in smaller bites and more often to save on time and keep your project moving along. If you’re short on time or money or your customers are hard to reach location wise, run your user interviews over the phone!
I’ve met people who aren’t a fan of the term ‘guerilla research’. I’ve been told it’s a negative term that can imply that you’re doing something you don’t have permission to be doing. Well guess what? Sometimes you are! We’re not all in privileged positions where UX research is an accepted and willingly supported practice. UX maturity comes in many shapes and sizes and some of us still need to prove the value of UX research to our stakeholders and organisations.
Hitting the streets or a customer facing environment (e.g., a store) with a mobile device for a few hours one afternoon is a good way to gather research insights quickly. While you will have to limit your interactions with participants to under 3 to 5 minutes, it can be a good way to get a lot of responses to a handful of big burning questions that you might be tackling during your discovery research.
As always, research begets research and this approach might give you the insights you need to secure buy in for a much larger piece of research. You might also use this technique to gather quantitative data or run a quick usability test a new feature. First-click testing tools like Chalkmark for example, are great for this because all the participant has to do is click on an image on a screen. It takes seconds for them to complete and you can include post study questions in the tool for them to answer or you can just have a conversation with them then and there.
When it comes to remote research there are a lot of different methods and techniques covering the entire design process from start to finish. It’s super flexible and scalable and the level of depth you can achieve in a short space of time and effort can be significant. The depth compromise here is not being in the same room as your participants. For example if you’re running a remote card sort with OptimalSort, you won’t get to hear a conversation about why certain cards were placed where they were, however you will gather a decent amount of solid quantitative data quickly and most of the analysis work is done for you saving even more time. You can also fill in any qualitative research gaps by including pre and post study questions and you could also use your findings to help prove the need for resources to conduct face to face research to complement your remote study.
Also called split testing, live A/B testing on a website or app is a quick way to test out a new feature or an idea for a new feature. Much like with remote research, you won’t get to ask why your research participants did what they did, but you will obtain quantitative evidence of what they did in real time while attempting to complete a real task. It’s a quick and dirt cheap way to find out what does and doesn’t work. You could always ask your website visitors to complete a quick exit survey when they leave your website or app or you could consider positioning a quick poll that appears in the moment that they’re completing the task e.g., during checkout. You can test anything from a whole page to the language used in a Call to Action (CTA), and while the results are largely quantitative, you’ll always learn something new that you can use to inform your next iterative design decision.
When approaching push back conversations it can be helpful to try to understand where these requests or constraints are coming from and why. Why are you being told to just run a focus group? Why isn’t there any funding for participant recruitment or a reasonable amount of time for you to complete the research? Why has it been suggested that you skip talking to actual users or customers? And so on. Talk to your stakeholders. Consider framing it as you trying to understand their needs and goals better so that you can help them achieve them – after all, that is exactly what you’re trying to do.
Talk to your team and colleagues as well. If you can find out what is driving the need for the research depth compromise, you might just be able to meet any constraints halfway. For example, maybe you could pitch the option of running a mixed methods research approach to bridge any resourcing gaps. You might run a survey and 5 x 20 minute user interviews over the phone or a video call if you’re short on time for example. It’s also possible that there might be a knowledge gap or a misunderstanding around how long research takes and how much it costs. A little education can go a very long way in convincing others of the importance of UX research. Take your stakeholders along for the journey and do research together where possible. Build those relationships and increased UX maturity may follow.
Pushing back might feel intimidating or impossible, but it’s something that every UX researcher has had to do in their career. User and research advocacy is a big part of the job. Have confidence in your abilities and view these conversations as an opportunity to grow. It can take some practice to get it right, but we have a responsibility to our users, customers, team, stakeholders and clients to do everything we can to ensure that design decisions are supported by solid evidence. They’re counting on us to gather and provide the insights that deliver amazing experiences and it’s not unreasonable to have a conversation about how we can all work better together to achieve awesome things. It’s not about ensuring your research follows a pitch perfect plan. Compromise and pragmatism are completely normal parts of the process and these conversations are all about finding the right way to do that for your project.

For those new to the qualitative research space, there’s one question that’s usually pretty tough to figure out, and that’s the question of how many participants to include in a study. Regardless of whether it’s research as part of the discovery phase for a new product, or perhaps an in-depth canvas of the users of an existing service, researchers can often find it difficult to agree on the numbers. So is there an easy answer? Let’s find out.
Here, we’ll look into the right number of participants for qualitative research studies. If you want to know about participants for quantitative research, read Nielsen Norman Group’s article.
So you need to run a series of user interviews or usability tests and aren’t sure exactly how many people you should reach out to. It can be a tricky situation – especially for those without much experience. Do you test a small selection of 1 or 2 people to make the recruitment process easier? Or, do you go big and test with a series of 10 people over the course of a month? The answer lies somewhere in between.
It’s often a good idea (for qualitative research methods like interviews and usability tests) to start with 5 participants and then scale up by a further 5 based on how complicated the subject matter is. You may also find it helpful to add additional participants if you’re new to user research or you’re working in a new area.
What you’re actually looking for here is what’s known as saturation.
Whether it’s qualitative research as part of a master’s thesis or as research for a new online dating app, saturation is the best metric you can use to identify when you’ve hit the right number of participants.
In a nutshell, saturation is when you’ve reached the point where adding further participants doesn’t give you any further insights. It’s true that you may still pick up on the occasional interesting detail, but all of your big revelations and learnings have come and gone. A good measure is to sit down after each session with a participant and analyze the number of new insights you’ve noted down.
Interestingly, in a paper titled How Many Interviews Are Enough?, authors Greg Guest, Arwen Bunce and Laura Johnson noted that saturation usually occurs with around 12 participants in homogeneous groups (meaning people in the same role at an organization, for example). However, carrying out ethnographic research on a larger domain with a diverse set of participants will almost certainly require a larger sample.
How do you know when you’ve reached saturation point? You have to keep conducting interviews or usability tests until you’re no longer uncovering new insights or concepts.
While this may seem to run counter to the idea of just gathering as much data from as many people as possible, there’s a strong case for focusing on a smaller group of participants. In The logic of small samples in interview-based, authors Mira Crouch and Heather McKenzie note that using fewer than 20 participants during a qualitative research study will result in better data. Why? With a smaller group, it’s easier for you (the researcher) to build strong close relationships with your participants, which in turn leads to more natural conversations and better data.
There's also a school of thought that you should interview 5 or so people per persona. For example, if you're working in a company that has well-defined personas, you might want to use those as a basis for your study, and then you would interview 5 people based on each persona. This maybe worth considering or particularly important when you have a product that has very distinct user groups (e.g. students and staff, teachers and parents etc).
The scope of the topic you’re researching will change the amount of information you’ll need to gather before you’ve hit the saturation point. Your topic is also commonly referred to as the domain.
If you’re working in quite a confined domain, for example, a single screen of a mobile app or a very specific scenario, you’ll likely find interviews with 5 participants to be perfectly fine. Moving into more complicated domains, like the entire checkout process for an online shopping app, will push up your sample size.
As Mitchel Seaman notes: “Exploring a big issue like young peoples’ opinions about healthcare coverage, a broad emotional issue like postmarital sexuality, or a poorly-understood domain for your team like mobile device use in another country can drastically increase the number of interviews you’ll want to conduct.”
Does the location of your participants change the number you need for qualitative user research? Well, not really – but there are other factors to consider.
Recruitment is understandably an intensive logistical exercise with many moving parts. If you’ve ever had to recruit people for a study before, you’ll understand the need for long lead times (to ensure you have enough participants for the project) and the countless long email chains as you discuss suitable times.
Outsourcing your participant recruitment is just one way to lighten the logistical load during your research. Instead of having to go out and look for participants, you have them essentially delivered to you in the right number and with the right attributes.
We’ve got one such service at Optimal, which means it’s the perfect accompaniment if you’re also using our platform of UX tools. Read more about that here.
So that’s really most of what there is to know about participant recruitment in a qualitative research context. As we said at the start, while it can appear quite tricky to figure out exactly how many people you need to recruit, it’s actually not all that difficult in reality.
Overall, the number of participants you need for your qualitative research can depend on your project among other factors. It’s important to keep saturation in mind, as well as the locale of participants. You also need to get the most you can out of what’s available to you. Remember: Some research is better than none!
Summary: The notetaking side of qualitative research is often one of the most off-putting parts of the process. We developed Reframer to make this easier, so here are 6 tips to help you get the most out of this powerful tool.
In 2018, a small team at Optimal Workshop set out to entirely revamp our approach of providing learning resources to our users and community. We wanted to practice what we preached, and build a new blog website from the ground up with a focus on usability and accessibility. As you can probably imagine, this process involved a fair amount of user research.
While we certainly ran our fair share of quantitative research, our primary focus was on speaking to our users directly, which meant carrying out a series of user interviews – and (of course) using Reframer.
There’s really no overselling the value of qualitative user research. Sure, it can be off-putting for new researchers due to its perceived effort and cost, but the insights you’ll gain about your users can’t be found anywhere else.
We knew of the inherent value in qualitative research, but we were also aware that things like interviews and usability testing would be put off due to the time required to both carry out the tests and time spent hours in workshops trying to pull insights out of the data.
So, with that in mind, here are 6 tips to make the most out of our recently released from beta tool, Reframer!
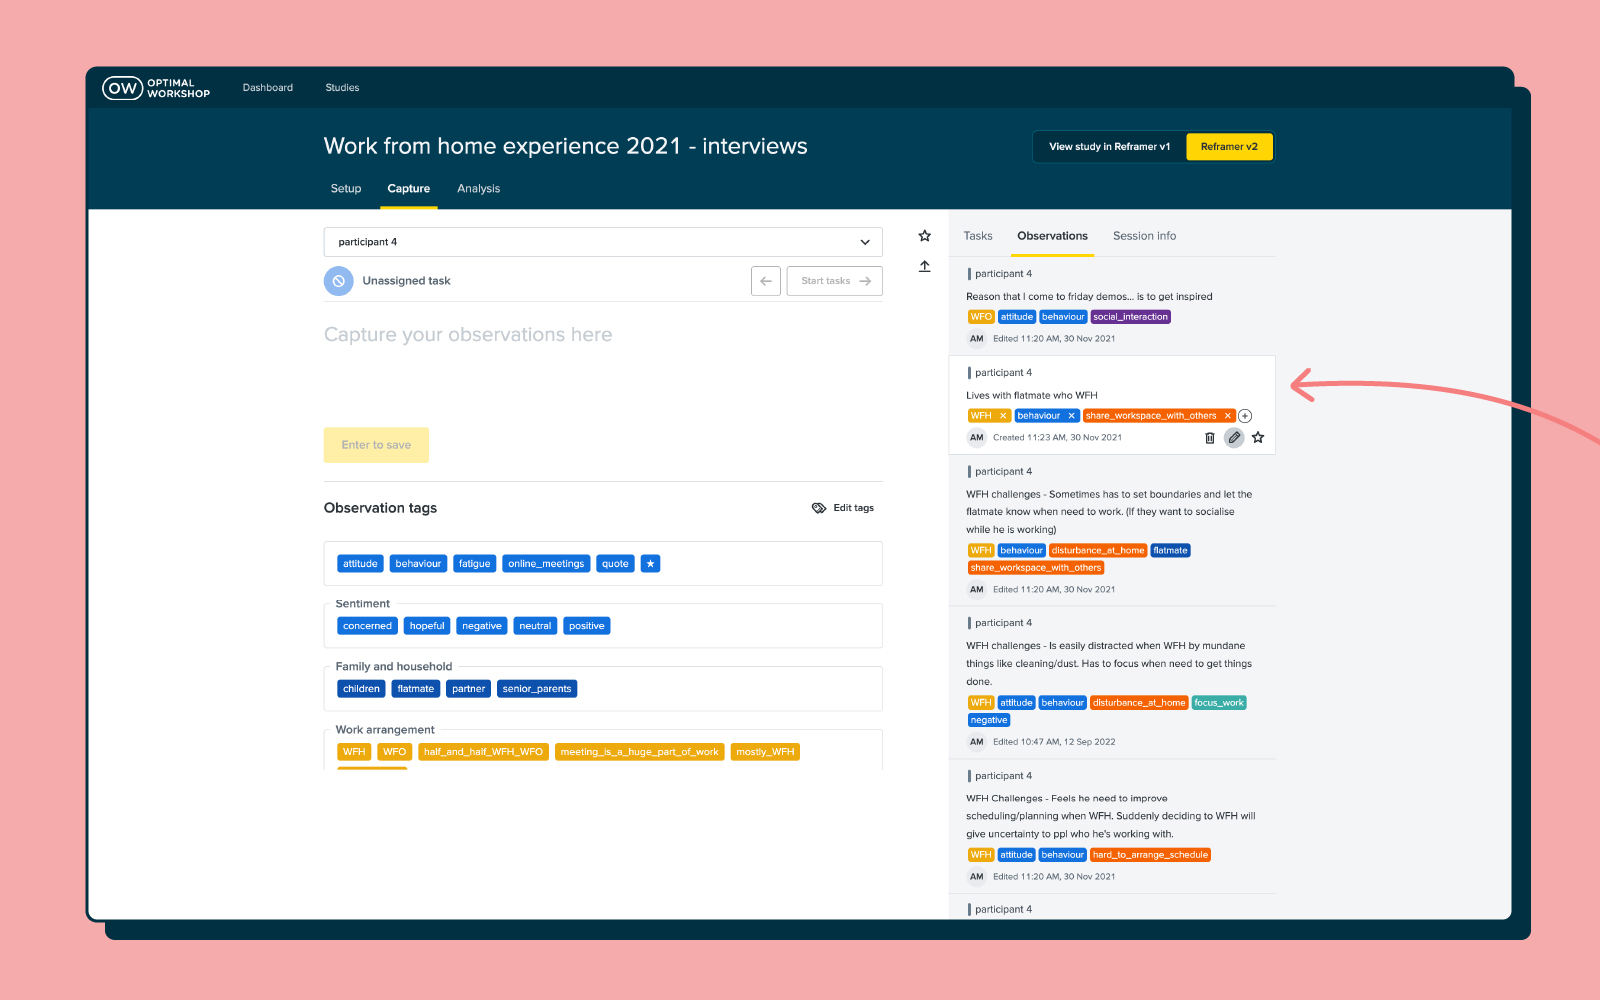
Observations are a core piece of the puzzle when it comes to effectively using Reframer. Observations are basically anything you see or hear during the course of your interview, usability test or study. It could be something like the fact that a participant struggled with the search bar or that they didn’t like the colors on the homepage.
Once you’ve collected a number of observations you can dive into the behaviors of your users and draw out patterns and themes – more on this further on in the article.
As for creating good observations using Reframer, here are a few tips:
The ability to tag different observations is one of the most powerful aspects of Reframer, and can significantly speed up the analysis side of research. You can think of tags as variables that you can use to filter your data later. For example, if you have a tag labeled “frustrated”, you can apply it to all of the relevant observations and then quickly view every instance when a participant was feeling frustrated after you’ve concluded your test.
When it comes to user interviews and usability tests, however, there are a couple of things to keep in mind when tagging.
For user interviews, it’s best not to apply tags until after you’ve finished the session. If you go and preload in a number of tags, you’ll likely (if unintentionally) introduce bias.
For usability tests, on the other hand, it’s best to set up your tags prior to going into a session. As just one example, you might have a number of tags relating to sentiment or to the tasks participants will perform. Setting up these types of tags upfront can speed up analysis later on.
If there’s one universal rule to keep in mind when it comes to Reframer tags, it’s that less is more. You can use Reframer’s merge feature to consolidate your tags, which is especially useful if you’ve got multiple people adding observations to your study. You can also set up groups to help manage large groups of tags.
Yes, it’s tempting to just shut your laptop and focus on something else for a while after finishing your session – but here’s an argument for spending just a little bit of time tidying up your data.
The time straight after a session has finished is also the best time to take a quick pass over your observations. This is the time when everything about the interview or usability test is still fresh in your mind, and you’ll be able to more easily make corrections to observations.
In Reframer, head over to the ‘Review’ tab and you’ll be presented with a list of your observations. If you haven’t already, or you think you’ve missed some important ones, now is also a good time to add tags.
You can also filter your observations to make the process of reviewing data a little easier. You can filter by the study member who wrote the observation as well as any starred observations that study members have created. If you know what you’re looking for, the keyword search is another useful tool.
Taking the time to make corrections to tags and observations now will mean you’ll be able to pull much more useful insights later on.
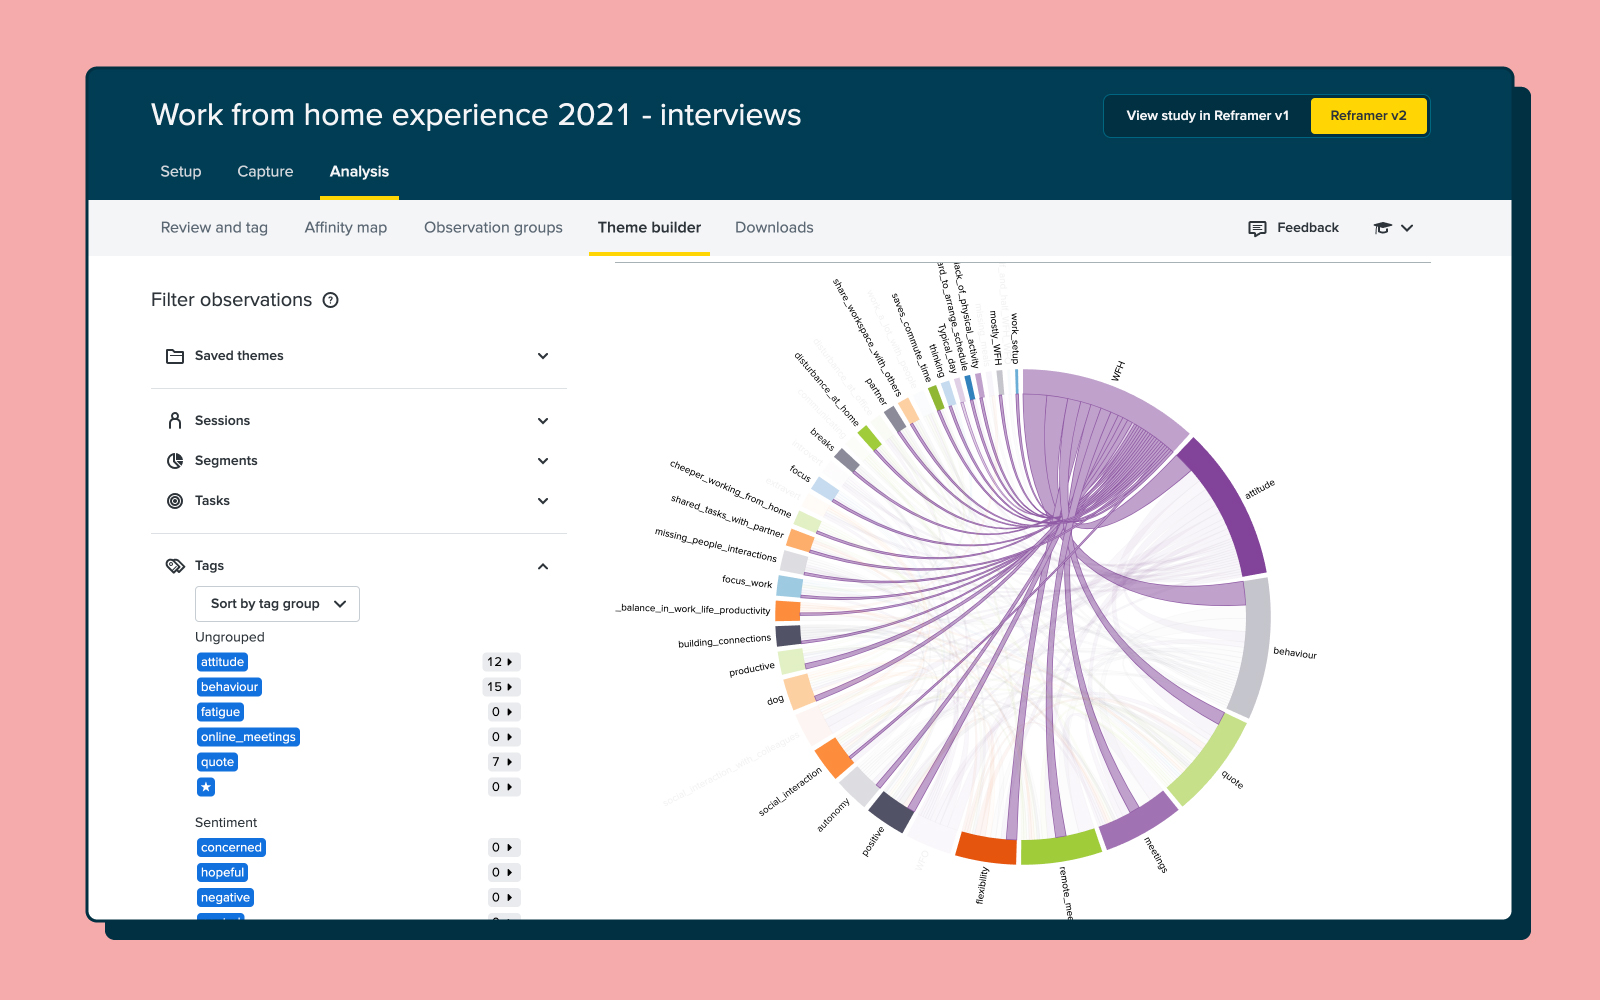
With all of your observations tidied up and tags correctly applied, it’s time to turn our attention to the theme builder. This is one of the most powerful parts of Reframer. It allows you to see all of the different relationships between your tagged observations and then create themes based on the relationships.
The really neat thing with the theme builder is that as you continue to work on your study by feeding in new observations, the top 5 themes will display on the Results Overview page. This means you can constantly refer back to this page throughout your project. Note that while the theme builder will update automatically, it’s best to tag as many observations as possible to get the most useful data.
You can read a detailed guide of how to actually create themes using the theme builder in our Knowledge Base article.
So, whether your experience with Reframer starts with this article or you’ve already had a play around with the tool, it should be clear that tags are important. This functionality is really what enables you to get the kind of analysis and insight that you can out of your data in Reframer.
But you can actually take this a step further and transform the data from your tagging into visualizations – perfect for demonstrating your results to your team or to stakeholders. There are 2 visualization options in Reframer.
First of all, there’s the chord diagram. As you can see from the picture below, the chord diagram allows you to explore the relationships between different tagged observations, which in turn helps you to spot themes. The different colored chord lines connect different tag nodes, with thicker lines representing the more times 2 tags appear on the same observation. Again, the more data you have (observations and tags), the richer or more in-depth the visualization.
The bubble chart is a little different. This visualization simply shows the frequency of your tags as ‘bubbles’ or circles. The larger the bubble, the more frequently that tag appears in your observations.
Reframer works best when it’s used as the one repository for all of your qualitative research. After all, we designed the tool to replace the clutter and mess that’s typically associated with qualitative research.
You can easily import all of your existing observations from either spreadsheets or text documents using the ‘Import’ function. It’s also possible to just enter your observations directly into Reframer at any point.
You’ll likely find that by using Reframer in this way, there’ll be little chance of you losing track of research data over time. One of the biggest issues for research or UX teams is information loss when someone leaves the organization. Keep everything in Reframer, and you can avoid that loss of data if someone ever leaves.
While quantitative research is often considered easiest to wrap your head around, qualitative research is also well-worth adding into to your workflow to ensure you're seeing the whole picture as you make important design decisions. This article is really just a surface-level overview of some of the neat things you can do with Reframer. We’ve got some other articles on our blog about how you can best use this tool, but the best place to really dig into the detail is in the Optimal Workshop Knowledge Base.
Summary: You’ve run some user interviews and a couple of cards sorts, now it’s time to learn how to make the case for larger research projects.
In many ways, the work you do as a researcher is the fuel that product and design teams use to build great products. Or, as writer Gene Luen Yang once put it: “Creativity requires input, and that's what research is. You're gathering material with which to build”.
One of the toughest challenges for a user researcher is making the case for a bigger project. That is, one potentially involving more participants, a larger number of research methods, more researchers and even new tools. Sure, you’ve done small studies, but now you’ve identified a need for some bigger (and likely more expensive) research. So how exactly do you make a case for a larger project? How do you broach the subject of budget and possibly even travel, if it’s required? And, perhaps most importantly, who do you make the case to?
By understanding how to pitch your case, you can run the research project that needs to be run – not whatever you’re able to scrape together.
You know how important the research question is. After all, this is what you center your research around. It’s the clear, concise, focused and yet also complex heart of any research project. The importance of a good research question holds true from the smallest of studies right through to the massive research projects that require large teams of researchers and involve usability tests in real-world locations.
We’ve written about user research questions before, but needless to say, keep your question top-of-mind as you think about scaling your research. While most other aspects of your research will get bigger the larger your research project grows (think things like budget, number of participants and possibly even locations), your research question should remain concise and easy to understand. ‘Say it in a sentence’ – This is a good rule to keep in mind as you start to meet with stakeholders and other interested parties. Always have the detail ready if people want it, but your question is basically an elevator pitch.
Your research question will also form an important part of your pitch document – something we’ll come back to later on in this article.
With your research question in hand (or more likely in a Google Drive document), you have to start asking yourself the tough questions. It’s time to map out the why of this entire process. Why exactly do you need to run a larger research project? Nailing all of this detail is going to be critical to getting the support you need to actually scale up your research.
To help get you thinking about this, we’ve put together some of the most common reasons to scale a user research project. Keep in mind that there’s a lot of crossover in the below sections simply due to the fact that methods/tools and participants are essentially 2 sides of the same coin.
Recruiting participants can be quite expensive, and it’s often a limiting factor for many researchers. In many cases, the prospect of remunerating even something like 10 participants can blow out a small research budget. While certain types of testing have ideal maximums for the number of participants you should use, scaling up the number of people feeding into your research can be quite fruitful. This could either running more tests with a lower number of participants or running a few tests with more.
By bringing in more people, you’re able to run more tests over the course of your project. For example, you could run 5 card sorts with different groups. Or, you could carry out a larger series of usability tests and user interviews with groups of different demographics and in different locations.
It’s easy to see how useful a larger or even unrestricted recruitment budget can be. You can go from needing to scrounge up whoever you can find to recruiting the ideal participants for your particular project.
User research has been around in one form or another for decades (and possibly even longer if you loosen your definition of ‘user research’). With this in mind, the types of tools available to researchers have come along way since the days of paper prototypes – and even paper card sorts. Now, a cursory Google search will throw up dozens of UX tools tailored for different research methods and parts of the research process. There are tools for validating prototypes, getting fast feedback on UX copy and running complex, branching surveys. As just one example, we (at Optimal Workshop) offer a number of tools as part of our platform, focusing on areas including:
You can read more about the Optimal Workshop platform here on our features page if you’re interested in learning more.
Integrating more tools is a strong reason to scale a research project, as tools can both lighten your workload and open up entirely new avenues of research. Plus, you’ll often find tools will automate difficult parts of the research process, like recruitment and analysis. Using one of our tools as an example, with Reframer, you can take notes during a user interview, tag them, and then Reframer will help you pull out various themes and insights for you to review.
A bigger project usually means a bigger budget, allowing you to spend time investigating possible new methods, tools and research techniques. Always wanted to investigate tree testing but could never quite find the time to sit down and assess the method and the various tools available? Now could be the perfect time.
Remote testing has fast become one of the most practical options for user researchers who are short on time and budget. Instead of needing to go out and physically sit down with participants, researchers can instead recruit, run tests and analyze results as long as they have a decent internet connection. It makes sense – on-location research is expensive. But there are definitely some major advantages.
It is possible to conduct user interviews and usability tests remotely, but the very nature of these types of research means you’ll get a lot more out of doing the work in person. Take a user interview as just one example. By sitting down face to face with someone, you can read their facial expressions, better pick up on their tone and establish a stronger rapport from the outset.
Being able to go to wherever your users are means you’re not constrained by technology. If you need to study people living in rural villages in China, for example, you’re unlikely to find many of these people online. Furthermore, in this example, you could bring along a translator and actually get a real feel for your audience. The same applies to countless other demographics all over the world. Scaling up your research project means you can start to look at traveling to the people who can give you the best information.
One of the most important (and potentially difficult) parts of scaling a research project is getting buy-in from your stakeholders. As we’ve mentioned previously, your pitch document is an essential tool in getting this buy-in, but you also need to identify all of your stakeholders. Knowing who all of your stakeholders are will mean you get input from every relevant area in your organization, and it also means you’ll likely have a larger support base when making your pitch to scale your research project.
Start by considering the wider organization and then get granular. Who is your research project likely to impact? Consider more than just product and design teams – how is your larger project likely to impact the budget? Again, capturing all of this detail in the pitch document will help you to build a much stronger case when it comes to convincing the people who have the final say.
Note: Building strong relationships with C-level and other people with influence is always going to be useful – especially in a field like UX where many people are still unsure of the value. Investing time into both educating these people (where appropriate) and creating a strong line of communication will likely pay dividends in future.
If you’re from the world of academia, the idea of pitching your research is likely second nature. But, to a user researcher, the ‘pitch’ often takes many forms. In ideal circumstances, there’s a good enough relationship between researchers and UX teams that research is just something that’s done as part of the design process. In organizations that haven’t fully embraced research, the process is often much more stilted and difficult.
When you’re trying to create a strong case for scaling your research project, it can help to consolidate all of the detail we’ve covered above (research question, high-level reasons for a running a larger project, etc.) and assemble this information in the form of a pitch document. But what exactly should this document look like? Well, borrowing again from the world of institutional research (but slightly tweaked), the main purpose of a research proposal is to explain that:
With this in mind, it’s time to take a look at what you should include in your user research pitch document:
You don’t necessarily need to take your pitch document and present it to stakeholders, but as a tool for ensuring you’ve covered all your bases, it’s invaluable. Doing this exercise means you’ll have all of the relevant information you require in one place.
Happy researching!
Lately, I’ve found myself sitting in the participant’s chair at the UX research table more and more and it’s been an eye-opening collection of experiences. As UX researchers, we’re definitely not our users, but we are someone else’s. We use products, services and tools too! I’ve recently discovered that participating in user research not only helps out a fellow UXer with their qualitative research, but has also helped me grow my skills.
Here are 3 reasons why you should try being a participant for yourself.
Having facilitated hundreds of UX research sessions over the years, I didn’t think I would be as nervous as I was going in as a participant! When we design our research sessions we don’t often give our participants a heads up on what we’re going to talk about because we don’t want to influence them for one, but truly not knowing what to expect made me feel slightly jittery. Before and at the beginning of these experiences, I felt quite unprepared. I wasn’t expecting to feel that way.
During these sessions I often found myself wondering things like: Were my answers detailed enough? Will my responses be kept confidential? (I could never seem to remember if that had been covered in the introduction!). I worried that I wasn’t giving helpful responses or if I was talking too much. When misunderstandings arose in the conversation, I felt responsible and I was kicking myself for not communicating clearly enough!
As a participant, I completely lost track of time during the session and developed an entirely new appreciation for timekeeping as a facilitator! I could have talked well beyond the scope of the interview timeframe and needed to be kept on track.
I also very quickly discovered that thinking aloud is a lot harder to do than it sounds. It’s not a simple matter of verbalizing your thoughts as they happen. You have to think them, process them, decide how to verbalize them and then talk – all while someone (often a complete stranger) is looking at you expectantly and eagerly. It’s awkward and it feels weird. And look, it is widely acknowledged that it’s challenging and unnatural, but I didn’t fully appreciate or understand that until I was required to do it myself in a research environment.
Did I experience some of these thoughts and feelings because I’m a UX researcher and I know what the other side looks and feels like? Maybe. It’s certainly possible and I’d be remiss if I didn’t call out this potential bias, but I do feel that having done this I now have a greater capacity to empathize with the participant experience. I’ve now been on the receiving end of the introductory spiel (and tuned out during it!), I’ve now got first-hand experience with the on-the-spot answering of those questions we carefully craft and I’ve scrambled for words when I’ve been asked to explain why I said what I said.
These experiences have taught me that there’s a good chance the participant is just as nervous as I am and that a little reassurance or confirmation of usefulness goes a very long way. I’ve learned that regardless of the skill or experience of the researcher, interview questions can be super confusing and hard to answer. Having questions rephrased and being told that what I shared was helpful made me feel significantly more comfortable and able to think clearly and open up more - therefore providing more value to the researcher.
I’ve also been itching to find out what happened next after the sessions ended. Was I helpful and in what way? Where did the insight I provided lead? I’ve learned that while we walk away with more questions, so might our participants and what can we do about that? We’re so busy, but stopping for a moment further down the track if/where possible to reach out and say ‘Hey, I just thought you might like to see what we did with all that great information you shared with us’ might be nice. It’s not always practical or possible and sometimes we have to wait until the thing goes live, but it’s food for thought.
Every UX researcher is different and we all have our own approaches and styles. As a notetaker for other researchers, I’ve always enjoyed having the opportunity to observe them in action, but somehow experiencing it as a participant felt different in the best possible way. It felt more immersive. Perhaps it was because I didn’t have to think about anything else or observe the participant’s reactions and was able to absorb every second of that experience as it was happening to me rather than in front of me.
I participated in a usability testing session with two researchers - one facilitating and one taking notes - and the notetaker was so unobtrusive and quiet that I completely forgot they were there! They said a quick hello at the beginning of the session and then sat back behind me and blended in with the furniture and didn’t make a sound until they piped up with a question at the very end. Note taking is such a grossly underrated UX research skill. There’s a lot to think about, a lot to avoid thinking about (e.g., jumping into solution right there in the session) and of course we have to be mindful of the potential impact of our behavior on the participant, but this went beyond stifling disappointment or resisting the urge to speak. This was a dignified and seamlessly elegant note taker existence unlike anything I have ever seen.
In other sessions as a user interview participant I was delighted when researchers injected multiple moments of humor into those previously mentioned introductory spiel snooze fests. It did more than just make me feel comfortable - humor helped me focus better on what was being said and remember important details during and well after the session had ended.
I also learned a thing or two about comfortable silences when I participated in a contextual session with two researchers. One researcher kept prodding and repeatedly asking questions while the other exuded a quiet and calm demeanor and simply patiently waited for me to complete my task and talk about it in my own time (and way). It won’t work in all situations or with all participants, but it made me feel relaxed and comfortable enough to talk through what I was thinking and seeing. This approach also made thinking aloud easier for me.
It’s important to remember that it doesn’t matter if you’re an experienced UX researcher or if you’re just starting out, everyone can learn something new from another researcher and stepping up into a session as an actual participant is a great way to do that.
One of my favourite things about the UX industry has always been its sense of community. We’re a group of people who care. We care about our users, we care about each other and we care about our capability as an industry and where we’re headed. Agreeing to be a participant in another researcher’s study is a great way to give back.
As I mentioned earlier, we use products and services too and in addition to this, there’s a whole heap of them out there designed just for us! It makes sense that in the same way that we as researchers ask our own customers and users to help us design better products, we should be open to doing the same for the people who design for us.
The cool thing about being a participant who is also a researcher is that we pick up issues other people might not. We might be a little tougher and less likely to let a usability issue slide. We might be the person that provides the external and fresh-eyed validation a researcher needs to convince a stakeholder that a design needs to be changed or worked on some more. A researcher in the participant’s chair is a powerful hybrid - it’s a participant and expert reviewer in one.
As a general rule of thumb, if you’re invited to participate in another researcher’s study, I do think it’s best to always be upfront with them about who you are and what you do so that they can determine if you are potentially too biased to be included. It’s their study and informed consent matters. Think about what you would want as a researcher. And if they’re specifically asking you to participate because you’re a researcher - that’s awesome!
So those are just some of the reasons why you should take a spin in the participant’s chair. Professional development is a lifelong learning process for us all. I’m looking forward to implementing what I’ve learned from these experiences and continuing to plonk myself in that participant chair to keep growing my perspective and helping out other researchers along the way.
Happy researching (and participating)!

Within the UX industry, there are myriad terms and concepts you’ll need to understand in order to get your job done. One of the most common you’ll come across is information architecture (IA).
What is it? How do you find it? How do you research it? And how do you create it?
We’ve compiled an extensive directory where you can find authoritative content from information architects all over the world.
Read on to learn all the ins and outs of IA including topics for beginners, those with an intermediate skill level, and some bonus stuff for you experts out there.
Information architecture is the system and structure you use to organize and label content on your website, app or product. It’s the foundation on top of which you provide the design.
Every successful design project involves a good dose of user research. You need to be able to understand the behavior, thoughts, and feelings of people.
Here’s an overview of the different types of user research you can conduct for information architecture projects.
