Subscribe to OW blog for an instantly better inbox
Oops! Something went wrong while submitting the form.

In the field of user research, every method is either qualitative, quantitative – or both. Understandably, there’s some confusion around these 2 approaches and where the different methods are applicable. This article provides a handy breakdown of the different terms and where and why you’d want to use qualitative or quantitative research methods.
Let’s start with qualitative research, an approach that’s all about the ‘why’. It’s exploratory and not about numbers, instead focusing on reasons, motivations, behaviors and opinions – it’s best at helping you gain insight and delve deep into a particular problem. This type of data typically comes from conversations, interviews and responses to open questions. The real value of qualitative research is in its ability to give you a human perspective on a research question. Unlike quantitative research, this approach will help you understand some of the more intangible factors – things like behaviors, habits and past experiences – whose effects may not always be readily apparent when you’re conducting quantitative research. A qualitative research question could be investigating why people switch between different banks, for example.
Qualitative research is best suited to identifying how people think about problems, how they interact with products and services, and what encourages them to behave a certain way. For example, you could run a study to better understand how people feel about a product they use, or why people have trouble filling out your sign up form. Qualitative research can be very exploratory (e.g., user interviews) as well as more closely tied to evaluating designs (e.g., usability testing). Good qualitative research questions to ask include:
There’s no shortage of methods to gather qualitative data, which commonly takes the form of interview transcripts, notes and audio and video recordings. Here are some of the most widely-used qualitative research methods:
You don’t often need large numbers of participants for qualitative research, with the average range usually somewhere between 5 to 10 people. You’ll likely require more if you're focusing your work on specific personas, for example, in which case you may need to study 5-10 people for each persona. While this may seem quite low, consider the research methods you’ll be using. Carrying out large numbers of in-person research sessions requires a significant time investment in terms of planning, actually hosting the sessions and analyzing your findings.
On the other side of the coin you’ve got quantitative research. This type of research is focused on numbers and measurement, gathering data and being able to transform this information into statistics. Given that quantitative research is all about generating data that can be expressed in numbers, there multiple ways you make use of it. Statistical analysis means you can pull useful facts from your quantitative data, for example trends, demographic information and differences between groups. It’s an excellent way to understand a snapshot of your users. A quantitative research question could involve investigating the number of people that upgrade from a free plan to a paid plan.
Quantitative research is ideal for understanding behaviors and usage. In many cases it's a lot less resource-heavy than qualitative research because you don't need to pay incentives or spend time scheduling sessions etc). With that in mind, you might do some quantitative research early on to better understand the problem space, for example by running a survey on your users. Here are some examples of good quantitative research questions to ask:
Commonly, quantitative data takes the form of numbers and statistics.
Here are some of the most popular quantitative research methods:
While you only need a small number of participants for qualitative research, you need significantly more for quantitative research. Quantitative research is all about quantity. With more participants, you can generate more useful and reliable data you can analyze. In turn, you’ll have a clearer understanding of your research problem. This means that quantitative research can often involve gathering data from thousands of participants through an A/B test, or with 30 through a card sort. Read more about the right number of participants to gather for your research.
While there are certainly times when you’d only want to focus on qualitative or quantitative data to get answers, there’s significant value in utilizing both methods on the same research projects.Interestingly, there are a number of research methods that will generate both quantitative and qualitative data. Take surveys as an example. A survey could include questions that require written answers from participants as well as questions that require participants to select from multiple choices.
Looking back at the earlier example of how people move from a free plan to a paid plan, applying both research approaches to the question will yield a more robust or holistic answer. You’ll know why people upgrade to the paid plan in addition to how many. You can read more about mixed methods research in this article:
Now that you know the difference between qualitative and quantitative research, the best way to build confidence is to start testing. Hands-on experience is the fastest path to deeper insight. At Optimal, we make it easy to run your first study, no matter your role or research experience.

In today's rapidly evolving utility landscape, artificial intelligence presents unprecedented opportunities to transform customer engagement strategies. However, as UX professionals in the energy and utilities sector, it's crucial to implement these technologies thoughtfully, balancing automation with the human touch that customers still expect and value.
The energy and utilities sector faces unique challenges: managing peak demand periods, addressing complex billing inquiries, and communicating effectively during outages. AI can help address these challenges by:
While AI offers significant advantages, implementation requires careful consideration of when and how to deploy these technologies:
As you consider integrating AI into your customer engagement strategy, keep these guidelines in mind:
Optimal's user insights platform can be instrumental in ensuring your AI implementation truly meets customer needs:
Before implementing AI-powered self-service options, use Tree Testing to validate your information architecture:
When determining which tasks should be handled by AI versus human agents:
For AI-enhanced customer portals and apps:
Gather crucial insights about customer comfort with AI:
During the ongoing refinement of your AI systems:
When developing AI-powered customer interfaces for utilities:
As AI capabilities continue to evolve, the most successful utility companies will be those that thoughtfully integrate these technologies into their customer engagement strategies. The goal isn't to replace human interaction but to enhance it, using AI to handle routine tasks while enabling your team to focus on delivering exceptional service where human expertise, creativity, and empathy matter most.
By taking a balanced approach to AI implementation, supported by robust UX research tools like those offered by Optimal, UX professionals in the energy and utilities sector can create more responsive, personalized, and efficient customer experiences that meet the needs of today's consumers while preserving the human connection that remains essential to building lasting customer relationships.

We're thrilled to announce the re-launch of our Qualitative Insights tool, formerly known as Reframer. This powerful upgrade brings new features designed to revolutionize your qualitative data analysis process, making it faster, easier, and more insightful than ever before.
Qualitative Insights has always been your go-to tool to help you plan and organize interviews, take notes, tag, and analyze rich, unstructured data. Now, we've taken it to the next level with two game-changing additions:
The new Insights feature transforms how you work with qualitative data:
Manual insight creation
AI-Powered Insight Generation (Optional)
Our AI capabilities are designed to enhance your abilities, not replace them. Use AI to:
Remember, your expertise is crucial. Always review and refine AI-generated insights to ensure accuracy and capture nuances that only human understanding can provide.
We prioritize your privacy and data control:
Ready to experience the power of the new Qualitative Insights? Learn more and dive in. Upgrade your qualitative analysis workflow and uncover deeper insights faster than ever before with Qualitative Insights!
We've been hard at work enhancing your research capabilities, and we're excited to share what's new at Optimal. Here's what we've shipped to help you uncover even deeper insights:
Since launching the Beta, we've been collaborating closely with hundreds of Optimal customers to gather feedback and run usability testing. Your support has been invaluable, and we’re excited to announce these latest updates for Prototype Testing:
Improved security with password management: A new "Password settings" button allows users to manage stored passwords, which participants receive before starting their Prototype Study. Additionally, users are prompted for a password when importing protected prototypes.
Improvements to usability: Your feedback was taken onboard, and we’ve updated the buttons, including "Re-sync to file" and "Change prototype," to improve usability.
Results sharing: You can now easily share specific sections (e.g., analysis, tasks, clickmaps) via a URL with your stakeholders in just a few clicks. With the added protection of a password for secure access.
Participant data view: To speed up your data analysis and improve your workflows we’ve added task metrics in the "Results > Participants" table, showing tasks completed, skipped, and success percentage.
Notes tab in analysis: Users can now take notes directly in the Analysis section for Task Results, Click Maps, Paths, and Questionnaires.
This release makes it easier for users to analyze data faster with flexible export options and an improved format for questionnaire and survey downloads. Find out more about the updates below.
To get started, navigate to the Downloads tab under Results. Results Downloads are available for all tools except for Qualitative Insights.
We’re just days away from the re-launch of our Qualitative Insights tool, previously known as Reframer. This upgrade brings powerful new features to streamline and enhance your qualitative data analysis, making it faster, easier, and more insightful than ever.
With the new Insights feature, you can capture and organize key takeaways from studies more efficiently. Each Insight — which includes a title, description, and linked observations — will live under the new Insights tab, allowing you to quickly gather and manage critical findings. You can create Insights directly from your observations or leverage AI to accelerate insight discovery, surfacing hidden themes within your data.
AI-Driven Insights with full control: You and your organization retain complete control over AI usage. All AI-generated results are fully editable, giving you the flexibility to adjust or even turn off AI support for your studies. Use AI as much or as little as needed, with peace of mind over your data management.
Enhanced usability
Our survey relaunch focuses on significantly improving usability, making creating, editing, and launching surveys easier than ever. Key releases coming late 2024 include:
By the end of the year, we’ll be adding Video Recording to our Prototype Testing tool. This new feature will allow you to better understand user experiences, and gain even deeper insights during a Prototype test. Video recording will be browser-based, with no plug-in required, eliminating setup complexities. Participant consent to record screen, face and voice is all taken care of by Optimal and captured upfront in the testing process.
Join our research panel and influence Optimal's future! You'll get early access to new features and thank-you gifts for your time. Interested?
Email product@optimalworkshop.com

User research and design doesn’t fail because teams don’t care – it fails because there’s rarely time to explore every option. When deadlines pile up, most teams default to the same familiar research patterns and miss opportunities to get more value from the tools they already have.
We’ve brought together practical, real-world ways to use Optimal – from tree testing and first-click testing to card sorting, surveys, prototype testing, and interviews. Some of these use cases are obvious, but many aren’t. All of them are designed to help teams move faster, reduce risk, and turn user insights into decisions stakeholders trust.
We’ve focused on quick wins and flexible examples you can adapt to your own context – whether you’re benchmarking navigation, validating early designs, improving conversion flows, prioritizing work, or proving the ROI of UX. You don’t need more tools or more processes. You just need smarter ways to use what you already have.
Let’s get into it.
Without a baseline for your navigation or information architecture (IA), you can’t easily tell if any changes you make have a positive effect. If you haven’t done so, benchmark your existing website on tree testing now. Upload your site structure and get results the same day. Now you’ll have IA scores to beat each month. Easy.
Watch video recordings of real people interacting with your sites with live site testing. Combine this with surveys and user interviews to understand where users struggled. You can also use the tree testing pietree to find out exactly where people are getting lost in your website structure and where they go instead.
If you’re just not sure where to begin then take a screenshot of your homepage, or any page that you think might have some issues and get going with first-click testing. Write up a string of things that people might want to do when they find themselves on this page and use these as your tasks. Surprise all your colleagues with a maddening heatmap or video recordings showing where people actually clicked in response to your tasks or where they struggle. Now you’ll have a better idea of which area of your site to focus on for your next step.
You can run live site testing as part of your discovery phase to baseline your live experiences and see how well your current site supports real user goals. Test competitors' sites to see how you stack up. You’ll quickly uncover opportunities to differentiate your site, all before a single wireframe is drawn. All that's required is a URL and then you're set to go. No code needed.
Tree testing is great for testing more than one content structure. It’s easy to run two separate tree testing studies, even more than two. It’ll help you decide which structure you and your team should run with, and it won’t take you long to set them up.
Discover how easy (or not) it is for users to navigate your sign up experience to ensure it works exactly as intended. Create a live site or prototype test to identify any confusion or points of friction. You could also use this test to understand users' first impressions of your home or landing page. Where do they click first and what information is valuable to them?
Use surveys, first-click tests, and card sorting to get your team involved and let their feedback feed your designs: logos, icons, banners, images, the list goes on... For example, by creating a closed image sort with categories, your team can group designs based on their preferences, you can get some quick feedback to help you figure out where you should focus your efforts.
Get a better sense of your users and customers’ motivations with surveys and user interviews. You can also find out what people actually want to see on your website with a card sort, by conducting an image sort of potential products. By providing categories like ‘I would buy this’, ‘I wouldn’t buy this’ to indicate their preferences for each item, you can figure out what types of products appeal to your customers.
The thoughts and feelings of your users are always important. A simple survey or user interview can help you take a deeper look at your checkout process, a recently launched product or service, or even the packaging your product arrives in. Your options are endless.
Companies that incorporate prototype testing in their design process can reduce development costs by 33%. Use prototype testing to ensure your designs hit the mark before you invest too heavily in the build. Build your own prototype with images in Optimal or import a Figma file. You can even test AI-generated prototypes from tools like Lovable or Magic Patterns by dropping the URL into live site testing.
Whether you’re running a blog or a UX conference, surveys can help you generate content ideas and understand any knowledge gaps that might be out there. Figure out what your users and attendees like to read on your blog, or what they want to hear about at your event, and let this feed into what you offer.
Sometimes a change in your product or service means you have to change how it’s presented to your existing customers. Ensure your customers understand the changes to your product or service with prototype and live site testing. Identify issues with user flow, content, or layout that may confuse them. Discover which options they’re most likely to choose with the updates. Uncover what truly matters to your customers.
Some people, including UX Agony Aunt, define return on UX as time saved, money made, and people engaged. By attaching a value to the time spent completing tasks, or to successful completion of tasks, you can approximate an ROI or at least illustrate the difference between two options.
User interviews are teeming with insights but can be time and resource intensive to analyze without automation. Use Optimal Interviews tool to capture key moments, reactions, and pain points with automated highlight reels and clips. These are perfect for storytelling, stakeholder buy-in, and keeping teams connected to who they’re building for.
Survey your organization to build a list of ideas for upcoming work. Understand your audience’s priorities with card sorting to inform your feature development. Categorize your upcoming work ideas to decide collectively what’s best to take on next. Great for clarifying what the team considers the most valuable or pressing work to be done.
Before you run an open card sort to generate new category ideas, you can run a closed card sort to find out if you have any redundant content. Say you wanted to simplify the homepage of your intranet. You can ask participants to sort cards (containing homepage links) based on how often they use them. You could compare this card sort data with analytics from your intranet and see if people’s actual behavior and perception are well aligned.
Onboarding new customers is crucial to keeping them engaged with your product, especially if it involves your users learning how to use it. You can set up a quick study to help your users stay on track with onboarding. For example, say your company provided online email marketing software. You can set up a first-click testing study using a photo of your app, with a task asking your participants where they’d click to see the open rates for a particular email that went out.
If you're lucky enough to attend a UX conference, you can now share the experience with your colleagues. You can easily jot down ideas, quotes and key takeaways in a Qualitative Insights project and keep your notes organized by using a new session for each presenter Bonus, if you’re part of a team, they can watch the live feed rolling into Qualitative Insights!
Tree testing and first-click testing allow you to compare multiple versions of content structures, designs, or flows. You can also compare how users engage with different live websites in one study. This helps decide the best-performing option without guessing.
Using card sorting for sociological research is a great way to deepen your understanding of how different groups may categorize information. For example, by looking at how young people group popular social media platforms, you can understand the relationships between them, and identify where your product may fit in the mix. Then, follow up with surveys or moderated interviews for deeper insights.
Your support and knowledge base within your website can be just as important as any other core action on your website. If your support site is lacking in navigation and UX, this will no doubt increase support tickets and resources. Make sure your online support section is up to scratch. Here’s an article on how to do it quickly.
Create a card sort with your search filters or tags as labels, and have participants rank them according to how important they consider them to be. Analytics can tell you half of the story (where people actually click), so the card sort can give another side: a better idea of what people actually think or want. Follow up with surveys or interviews to confirm insights.
Figure out if your icons are doing their job by testing whether your users are understanding them as intended. Uploading icons you currently use, or plan to use in your interface to first-click testing, and ask your users to identify their meaning by making use of post-task questions.
Optimal Interviews gives you automated insights but you can also engage with AI Chat to dive deeper. Ask AI specific questions about a feature or process or request quotes or examples. Then, get highlight reels and clips to match.
Make the marketing team’s day by doing a fast improvement on some core conversions on your website. Now, there are loads of ways to improve conversions for a check out cart or signup form, but using first-click testing to test out ideas before you start going live A/B test can take mere minutes and give your B version a confidence boost. For deeper insights, try a live site test.
As more and more people are using their smartphones for apps and to browse sites, you need to ensure its design gives your users a great experience. Test your mobile site to ensure people aren’t getting lost in the mobile version of your site. If you haven’t got a mobile-friendly design yet, now’s the time to start designing it!
Have a number of interviews you need to transcribe quickly? Upload up to 20 interviews at once in Optimal Interviews and get automated transcripts, so you can spend less time on admin and more time digging into insights.
People jumping off your website and not continuing their experience is something (depending on the landing page) everyone tries to improve. The metric ‘time on site’ and ‘average page views’ is a metric that shows the value your whole website has to offer. Again, there are many different ways to do this, but one big reason for people jumping off the website is not being able to find what they’re looking for. Use prototype testing or live site testing to watch users in action and understand where things break down.
No, you don’t have to spend thousands of dollars to go to all these countries to test, although that’d be pretty sweet. You can remotely research participants from all over the world, using our integrated recruitment panel. Start seeing how different cultures, languages, and countries interact with your website.
Whether you’re coming up with a new logo design, headline, featured image, or anything, you can preference test it with first-click testing. Create an image that shows the two designs side by side and upload it to first-click testing. From there, you can ask people to click whichever one they prefer! If you want to track multiple clicks per task or watch recordings, use prototype testing instead.
Use first-click testing to understand which elements draw users' attention first on your page. Upload your design and ask participants to click on the most important element, or what catches their eye first. The resulting heatmap will show you if your visual hierarchy is working as intended - are users clicking where you expect them to? This technique helps validate design decisions about sizing, color, positioning, and contrast without needing to build the actual page.
Get the tags and categories in your blog under control to make life easier for your readers. Set up a card sort and use all your tags and categories as card labels. Either use your existing ones or test a fresh set of new tags and categories.
Use AI-powered chat to instantly reformat interview insights and fast-track deliverables for different audiences. Simply specify the details of the deliverable you would like. For example: “Turn this into a 3-sentence Slack summary (no citations).” or “Rewrite this as an exec-ready insight with a clear recommendation.”
As designers, you’ve probably got umpteen designs floating around in your head at any one time. But which of these are really worth pursuing? Figure this out by using Optimal to test out wireframes of new designs before putting any more work into them.
Understand how users navigate help resources, report issues, and conceptualize support categories, especially when they need to locate assistance quickly in time-sensitive situations.
Yes, a good IA improves your SEO. Tree testing helps you understand how people navigate throughout your site. It also helps search engines better understand and index your content, making it more discoverable and relevant in search results. Make sure people can easily find what they’re looking for, and you’ll start to see improvement in your search engine ranking.
Find out what people think are the most important next steps for your team. Set up a survey or card sort and ask people to categorize items and rank them in descending order of importance or impact on their work. This can also help you gauge their thoughts on potential new features for your site, and for bonus points compare team responses with customer responses.
Use a card sort to understand how people perceive your brand, so you can shape or refine your brand personality, tone of voice, and style guidelines. Run this with stakeholders or your audience to uncover current perceptions and where they’d like your brand to go next.
Liven up the workday by creating a fun Easter egg hunt in first-click testing. Simply upload a photo (like those really hard “spot the X” photos), set the correct area of your target, then send out your study with participant identifiers enabled. You can also send these out as competitions and have closing rules based on time, number of participants, or both.
Would an icon or text link work better for navigating to your home page? Before you go ahead and make changes to your site, you can find out by setting up a first-click testing test.
Run a card sort, survey, or internal interviews to understand how responsibilities are perceived across different roles. Work with team leaders and managers to clarify role definitions, reporting lines, and decision-making authority. This helps uncover overlapping responsibilities and opportunities to streamline management and support team workflows.
If you’re running an e-commerce site, ease of use and a great user experience are crucial. To see if your shopping cart and checkout processes are as good as they can be, look into running a live site, prototype or first-click test.
Raise the visibility of good IA by running periodic IA health checks using tree testing and reporting the results. Proactively identifying structural issues early, and backing decisions with clear metrics, helps drive alignment and build confidence across stakeholders.
Heatmaps in our first-click testing tool are a great way of getting first impressions of any design. You can see where people clicked (correctly and incorrectly), giving you insights on what works and doesn’t work with your designs. Because it’s so fast to test, you can iterate until your designs start singing.
Thinking of launching a new product, app or website, or seeking opinions on an existing one? Remote focus groups can provide you with a lot of candid information that may help get your project off the ground. They’re also dangerous because they’re susceptible to groupthink, design by committee, and tunnel vision. Use with caution, but if you do then upload your recordings to Interviews for automated insights! Find patterns across sessions and use AI Chat to dig deeper. Pay attention to emotional triggers.
Whether you want the opinions of your users or from members of your team, you can set up a quick and simple survey. It’s super useful for getting opinions on new ideas (consider it almost like a mini-focus group), or even for brainstorming with teammates.
Use a card sort to understand what content matters most to people, so you can plan what to write first. Ask participants which information is most useful or which tasks they do most often. You can also run this after a top tasks survey to help shape your long list of content.
Got an idea you want to sanity-check before investing more time? Use surveys, first-click testing, or prototype testing to see if people understand the concept and find it valuable. A quick test now can save a lot of rework later.
You can add images to each card that allows you to understand how your participants may organize and label particular items. Very useful if you want to organize some retail products and want to find out how other people would organize them given a visual including shape, color, and other potential context.
For really quick first-click testing, take first-click testing on a tablet, mobile device or laptop to a local coffee shop. Ask people standing in line if they’d like to take part in your super quick test in exchange for a cup of joe. Easy!
Case study by Viget: “One of the most heavily used features of the website is its keyword search, so we wanted to make absolutely certain that our redesigned search box didn’t make search harder for users to find and use.” Use first-click testing to test different variations.
Optimal surveys give you plenty of question options, but one of the simplest ways to take the pulse of your product is an NPS survey to find out how likely they would recommend your product or brand. Use the out-of-the-box NPS question type question to quickly understand customer sentiment and track it over time.
Empathy – the ability to understand and share the experience of another person – is central to the design process. An empathy test is another great tool to use in the design phase because it enables you to find out if you are creating the right kind of feelings with your user. Take your design and show it to users. Provide them with a variety of words that could represent the design – for example “minimalistic”, “dynamic”, or “professional” – and ask them to pick out which words which they think are best suited to their experience.
Drop your email designs into first-click testing to see which version people prefer and where they click first. Use these insights to refine your layout, hierarchy, and calls to action to improve engagement and conversions.
Online survey tools can complement your existing research by sourcing specific information from your participants. For example, if you need to find out more about how your participants use social media, which sites they use, and on which devices, you can do it all through a simple survey questionnaire. Additionally, if you need to identify usage patterns, device preferences or get information on what other products/websites your users are aware of/are using, a questionnaire is the ticket.
Like most things, read a little, and then it’s all about practice. We’ve found that people who get the first click correct are almost three times as likely to complete a task successfully. Get your first clicks right in tree testing and first-click testing and you’ll start seeing your customers smile.
Evil attractors are those labels in your IA that attract unjustified clicks across tasks. This usually means the chosen label is ambiguous, or possibly a catch-all phrase like ‘Resources’. Read how to quickly identify evil attractors in the Destinations table of tree test results and how to fix them.
Check how people with different physical, visual, or cognitive needs move through your content, and spot any areas that might slow them down or cause confusion. Use what you uncover to remove friction and support all users.
An excellent way of gathering valuable qualitative insights alongside the results of your remote card sorts is to run a moderated version of the sorts with a smaller group of participants. When you can observe and interact with your participants as they complete the sort, you’ll be able to ask questions and learn more about their thought processes and the reasons why they have categorized things in a particular way.
Understand how customers perceive your brand by creating a closed card sort. Come up with a list of categories, and ask participants to sort images such as logos, and branded images.
Are these pictures exhilarating, or terrifying? Are they humorous, or offensive? Relaxing, or boring? Productive, or frantic? Happy memories, or a deep sigh?
Card sorting is a well-established technique in the ‘company values’ realm, and there are some great resources to help you and your team brainstorm the values you represent. These ‘in-person’ brainstorm sessions are great, and you can run a remote closed card sort to support your findings. And if you want feedback from more than a small group of people (if your company has, say, more than 15 staff) you can run a remote closed card sort on its own. Use Microsoft’s Reaction Card Method as card inspiration.
Use recorded videos and interviews to observe people interacting with physical products, kiosks, or mobile apps in real-world contexts. Record sessions, capture moments of friction, and bring those insights back into Optimal’s Interviews tool for automated insights.
It’s simple to ask your team about their thoughts, feelings, and motivations with a survey. You can choose to leave participant identifiers blank (so responses are anonymous), or you can ask for a name/email address. As a bonus, you can set up a calendar reminder to send out a new survey in the next quarter. Duplicate the survey and send it out again!
If your company has a physical environment in which your customers visit, you can research new structures using a mixture of tools in Optimal. This especially comes in handy if your customers require certain information within the physical environment in order to make decisions. For example, picture a retail store. Are all the signs clear and communicate the right information? Are people overwhelmed by the physical environment?
Whether it’s a physical library of books, or a digital drive full of ebooks, you can run a card sort to help organize them in a way that makes sense. Will it be by genre, author name, color or topic? Send out the study to your coworkers to get their input! You can also do this at home for your own personal library, and you can include music/CDs/vinyl records and movies!
Similar to how you’d design an IA, you can create a tree test to design an automated phone system. Whether you’re designing from the ground up, or improving your existing system, you will be able to find out if people are getting lost.
And that’s the list. This is not everything you can do with Optimal, but a solid reminder that meaningful user insights don’t have to be slow, heavy, or overcomplicated. Small, well-timed studies can uncover friction, validate decisions, and create momentum across teams.
Ready to get started?
Have a creative use case we missed? Let us know, we’re always learning from the ways our customers push research further, faster, and smarter.
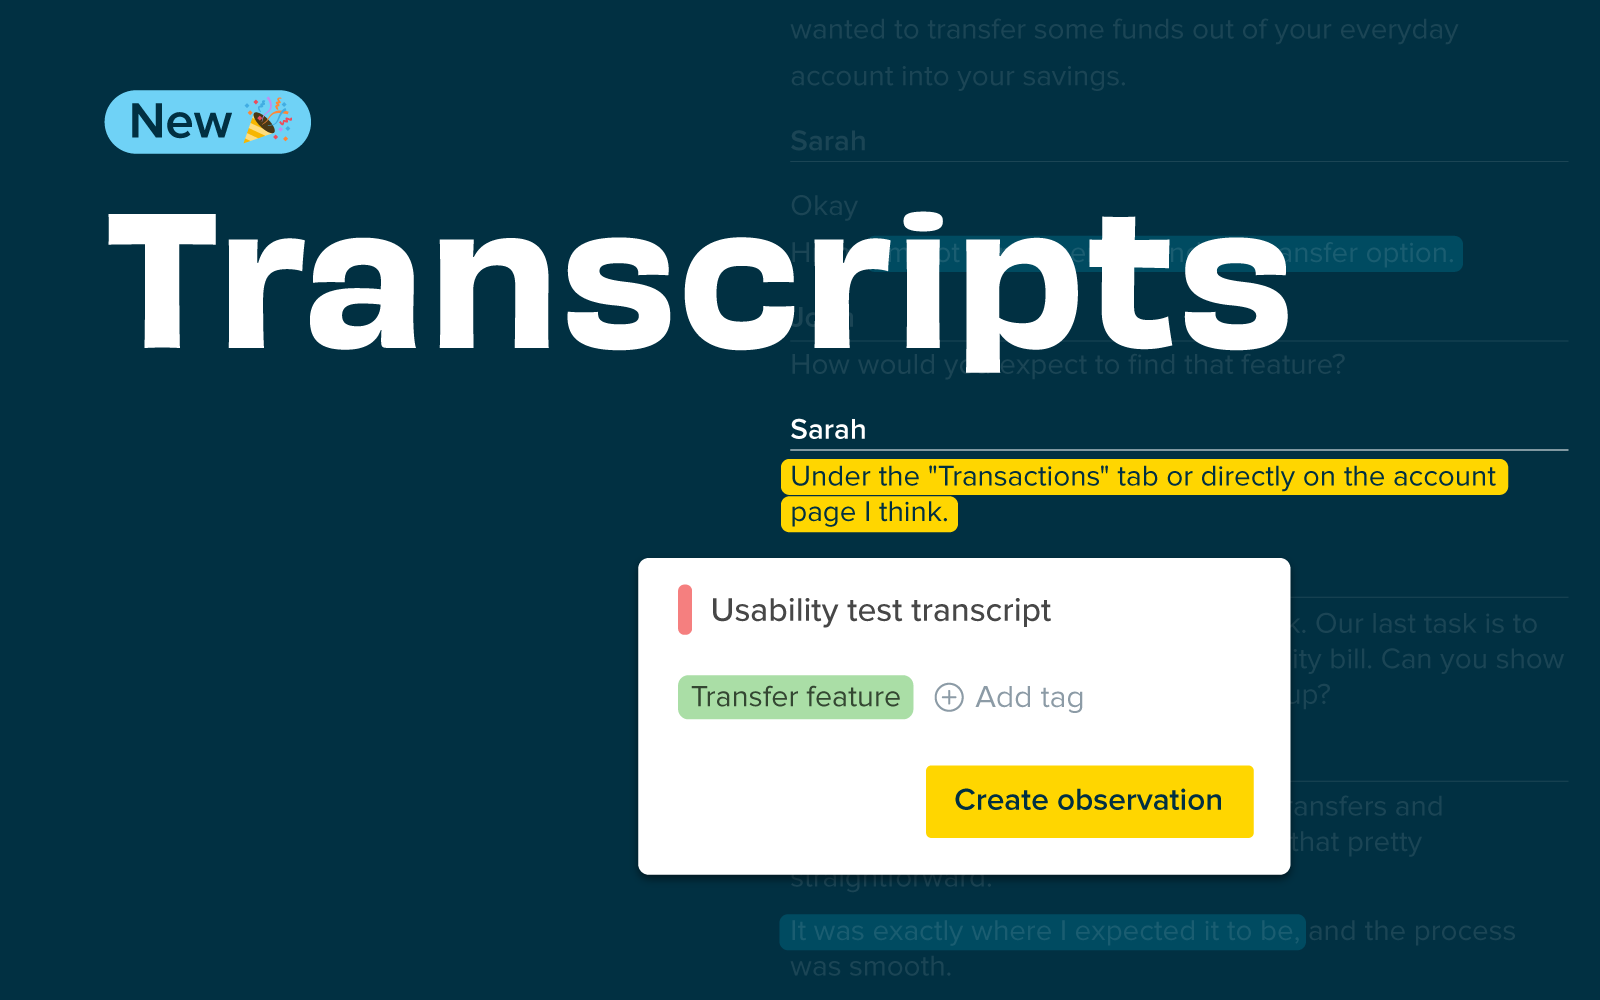
The accuracy of your data collection is crucial in qualitative research. It is vital that nothing is lost in translation or simply missed from the point of collection to analysis, and our latest release makes this even easier to achieve. You can now directly import interview transcripts into Qualitative Insights (previously known as Reframer), allowing you and your team to capture and tag observations effortlessly while maintaining the integrity of the information. Get ready to experience a new level of efficiency in your qualitative research!
Whether you are conducting interviews alone or with the support of your team, it’s important to prioritize building connections with participants rather than struggling to take notes and ask the right questions. Transcripts ensure you avoid losing crucial insights and context as you move from data collection to analysis and reduce the likelihood of human errors and missed observations that sometimes occur during live note-taking sessions.
It also enables smooth collaboration among team members by allowing them to review interviews and contribute to the analysis, even if they weren't present.
You can add a transcript to a new or existing study in Qualitative Insights with just a few clicks. After recording an interview or user testing session, open your Qualitative Insights study and click ‘Sessions’ then ‘+ Transcript.’

Add a session title, any session information or a link to the video for future reference in the session information box. If you have created segments, choose which ones apply to this participant; you can update these later at any time. Then click ‘import transcript.’

Click ‘Select transcript’ and ensure you made any edits before importing it. This feature supports .vtt, .srt, or .txt files. Now, click Capture observations’ to complete the import and create and tag your observations.
You will see your transcript displayed. If you use a .vtt or .srt file, you will see the speaker names have been identified. You can update the speaker names by clicking on configure speakers.
To create observations from your transcript, simply highlight text, enter a new tag or select an existing one, then click create an observation.
There is no limit to how many transcripts you can import. This means you can import all your past and future interviews, ensuring all your research data is in one place for easy access and analysis.
