Investing in prototype testing and user-focused design isn't just about creating better products—it's a proven strategy to save costs, accelerate timelines, and drive customer loyalty. According to Forrester Research, companies that incorporate prototype testing in their design process can reduce development costs by 33% and cut collaboration time by 25%. UX-focused companies also see products hit the market 50% faster and loyalty rise by 240% (Forrester Research, Nielsen Norman Group)!
Whether you're refining user flows, testing new concepts, or optimizing your onboarding experience or conversion flows, prototype testing helps ensure your designs hit the mark—before you invest too heavily in the build.
With those benefits in mind, let's dive into how prototype testing can help you deliver user-centered designs efficiently and effectively.
Common Use Cases for Prototype Testing
- Test Onboarding and Sign-Up Flows
How intuitive is your onboarding process? Prototype testing can help identify friction points, ensuring users can navigate and complete sign-ups seamlessly. For example, you can simulate different scenarios to determine whether users can easily register, set up accounts, or retrieve forgotten passwords. - A/B Test Email Designs
Test different layouts, calls-to-action (CTAs), or visual elements in your email prototypes to discover what resonates best with your audience. Measure metrics like click-through rates or time spent engaging with content to refine your design. - Evaluate User Flows and Wireframes
Whether you're testing a new feature, redesigning a user journey, or validating a wireframe, prototype testing gives you real-world insights. Observe how users interact with your design and identify areas for improvement before you move to development. - Test Concepts
Before launching a new idea, validate it through prototype testing. Let users interact with your concept to gauge feasibility and potential impact. This can save time and resources by helping you focus on ideas that resonate. - Evaluate Conversion Flows
Are users completing purchases or achieving desired outcomes? Use prototype testing to analyze conversion flows and pinpoint where users drop off. From landing pages to payment processes, you can optimize every step for success. - Test User Interfaces (UI)
Ensure your UI elements—buttons, navigation menus, or forms—are intuitive and accessible. Prototype testing can help you identify design inconsistencies or usability challenges early in the process. - Conduct Usability Tests
Have a new feature in development? Prototype testing lets you see how users interact with it, revealing insights that can guide refinements and improve overall satisfaction.
Real-Life Prototype Testing Scenarios
Airline
Imagine your flight has been canceled. Ask how your customers self-service on the airline website to find new flight options.
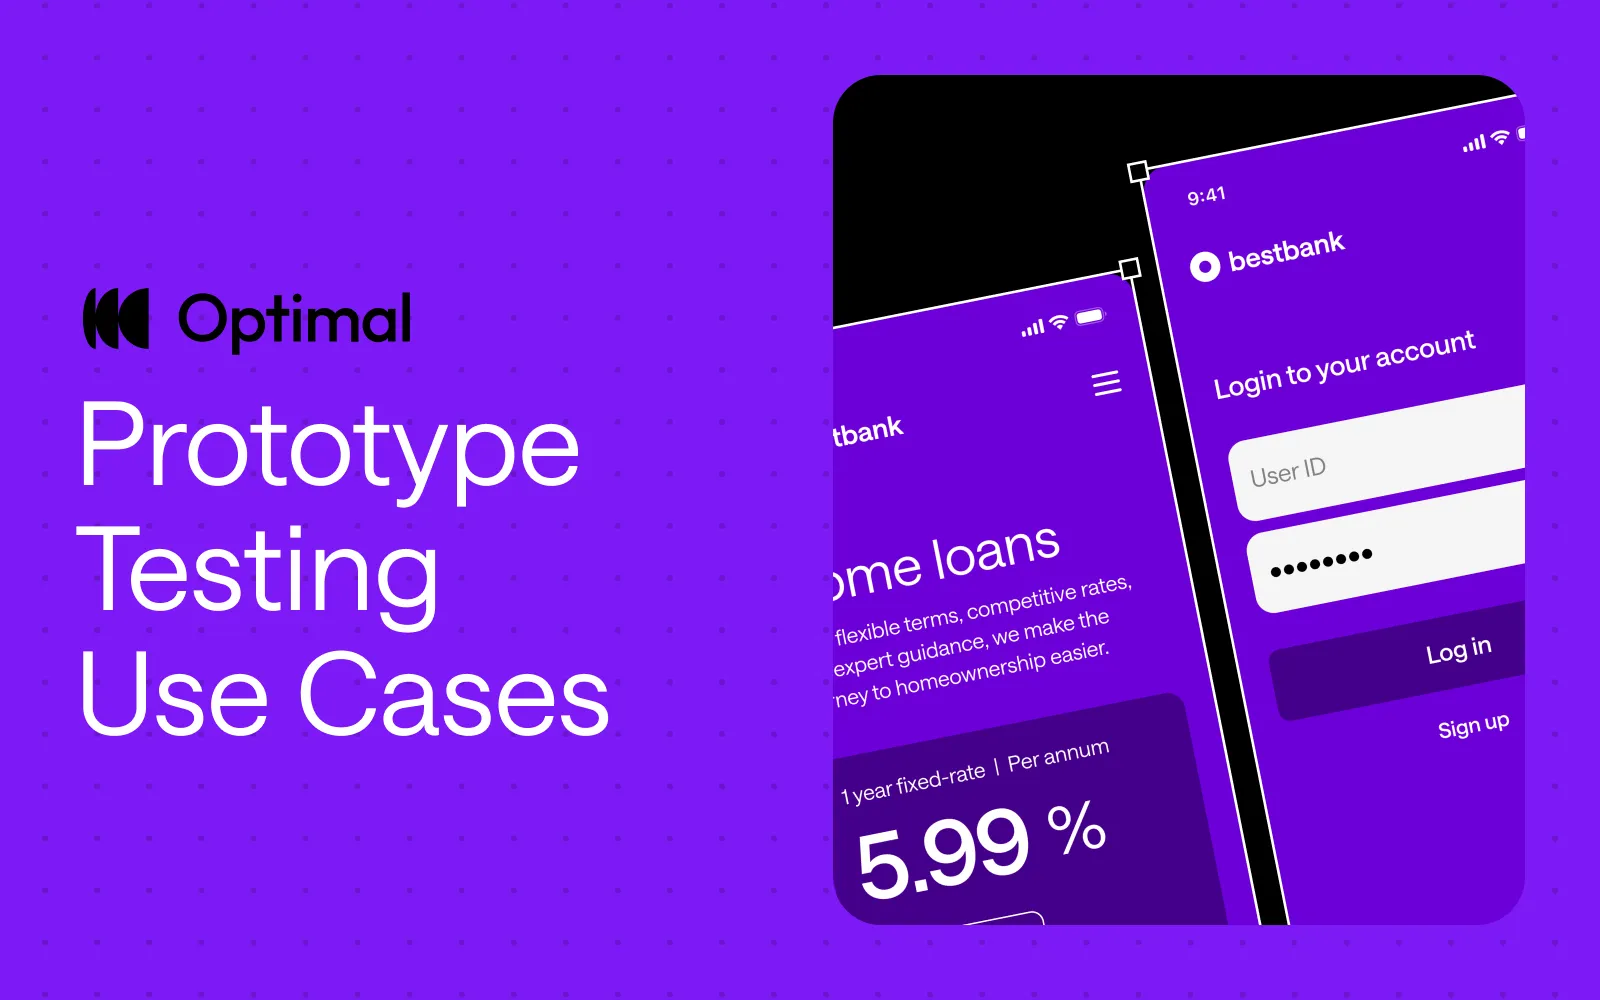
Bank
Have a prospect or customer interact with a prototype to open a business account online. Uncover usability issues and streamline the process.
Insurance
Imagine you’re interested in switching car insurance. Explore how intuitive it is for customers to view coverage details in an app, helping insurers improve navigation and accessibility.
Prototype Testing Analysis & Insights
Optimal’s prototype testing gives you a variety of analysis options to help you to evaluate the effectiveness and usability of your prototypes. Use these to see exactly how users navigate, where they face challenges, and what areas are proving to be successful.
- Task-based scenarios: Observe how users complete tasks like purchasing a product or updating account settings and set correction paths and destinations.
- Clickmaps: See how users navigate and locate information. See hits and misses on designated clickable areas, average task completion times, and heatmaps showing where users believed the next steps to be.
- Task results: Gather insights into how long it took to take a task (time taken), misclicks, directness score (considering backtracks or incorrect pathways), and success score.
- Participant paths: The Paths tab provides a powerful visualization, including thumbnails, to understand and identify common navigation patterns and potential obstacles participants encounter while completing tasks.
- Video, audio, and/or screen recording: See how your users interact with and respond to your prototype. Listen to their thought process and pick up on nonverbal cues, like hesitation, frustration, or confusion to pinpoint areas for improvement or exploration.
Ready to use prototype testing to help your team reduce development costs and get a faster time to market? Get started in your account by creating a new prototype test.
Not yet a user of Optimal? Sign up for a free 7-day trial.