Subscribe to OW blog for an instantly better inbox
Oops! Something went wrong while submitting the form.
"Hi Optimal Work,I was wondering if there are some best practices you stick to when creating or sending out different UX research studies (i.e. Card sorts, Prototyye Test studies, etc)? Thank you! Mary"
Indeed I do! Over the years I’ve learned a lot about creating remote research studies and engaging participants. That experience has taught me a lot about what works, what doesn’t and what leaves me refreshing my results screen eagerly anticipating participant responses and getting absolute zip. Here are my top tips for remote research study creation and launch success!
Screener questions are really useful for eliminating participants who may not fit the criteria you’re looking for but you can’t exactly stop them from being less than truthful in their responses. Now, I’m not saying all participants lie on the screener so they can get to the activity (and potentially claim an incentive) but I am saying it’s something you can’t control. To help manage this, I like to use the post-study questions to provide additional context and structure to the research.
Depending on the study, I might ask questions to which the answers might confirm or exclude specific participants from a specific group. For example, if I’m doing research on people who live in a specific town or area, I’ll include a location based question after the study. Any participant who says they live somewhere else is getting excluded via that handy toggle option in the results section. Post-study questions are also great for capturing additional ideas and feedback after participants complete the activity as remote research limits your capacity to get those — you’re not there with them so you can’t just ask. Post-study questions can really help bridge this gap. Use no more than five post-study questions at a time and consider not making them compulsory.
No matter how careful I am, I always miss something! A typo, a card with a label in the wrong case, forgetting to update a new version of an information architecture after a change was made — stupid mistakes that we all make. By launching a practice version of your study and sharing it with your team or client, you can stop those errors dead in their tracks. It’s also a great way to get feedback from the team on your work before the real deal goes live. If you find an error, all you have to do is duplicate the study, fix the error and then launch. Just keep an eye on the naming conventions used for your studies to prevent the practice version and the final version from getting mixed up!
Something that has come back to bite me more than once is failing to clearly explain when the study will close. Understandably, participants can be left feeling pretty annoyed when they mentally commit to complete a study only to find it’s no longer available. There does come a point when you need to shut the study down to accurately report on quantitative data and you’re not going to be able to prevent every instance of this, but providing that information upfront will go a long way.
You may think you’re setting yourself up to be bombarded with emails, but I’ve found that isn’t necessarily the case. I’ve noticed I get around 1-3 participants contacting me per study. Sometimes they just want to tell me they completed it and potentially provide additional information and sometimes they have a question about the project itself. I’ve also found that sometimes they have something even more interesting to share such as the contact details of someone I may benefit from connecting with — or something else entirely! You never know what surprises they have up their sleeves and it’s important to be open to it. Providing an email address or social media contact details could open up a world of possibilities.
It might seem really obvious, but I can’t tell you how many emails I received (and have been guilty of sending out) that are missing the damn link to the study. It happens! You’re so focused on getting that delivery right and it becomes really easy to miss that final yet crucial piece of information.
To avoid this irritating mishap, I always complete a checklist before hitting send:
First and foremost, before you create or disseminate a remote research study, you need to understand who it’s going to and how they best receive this type of content. Posting it out when none of your followers are in your user group may not be the best approach. Do a quick brainstorm about the best way to reach them. For example if your users are internal staff, there might be an internal communications channel such as an all-staff newsletter, intranet or social media site that you can share the link and approach content to.
And by that I’m talking about both the engagement mechanism and the study itself. I learned this one the hard way. Time is everything and no matter your intentions, no one wants to spend more time than they have to. Even more so in situations where you’re unable to provide incentives (yep, I’ve been there). As a rule, I always stick to no more than 10 questions in a remote research study and for card sorts, I’ll never include more than 60 cards. Anything more than that will see a spike in abandonment rates and of course only serve to annoy and frustrate your participants. You need to ensure that you’re balancing your need to gain insights with their time constraints.
As for the accompanying approach content, short and snappy equals happy! In the case of an email, website, other social media post, newsletter, carrier pigeon etc, keep your approach spiel to no more than a paragraph. Use an audience appropriate tone and stick to the basics such as: a high level sentence on what you’re doing, roughly how long the study will take participants to complete, details of any incentives on offer and of course don’t forget to thank them.
The default instructions in Optimal Workshop’s suite of tools are really well designed and I’ve learned to borrow from them for my approach content when sending the link out. There’s no need for wheel reinvention and it usually just needs a slight tweak to suit the specific study. This also helps provide participants with a consistent experience and minimizes confusion allowing them to focus on sharing those valuable insights!
When you’re on to something that works — turn it into a template! Every time I create a study or send one out, I save it for future use. It still needs minor tweaks each time, but I use them to iterate my template.What are your top tips for creating and sending out remote user research studies? Comment below!

If you missed our live training, don’t worry, we’ve got you covered! In this session, our product experts Katie and Aidan discuss why, how and when to benchmark an existing structure using Treejack.
They also talk through some benchmarking use cases, demo how to compare tasks between different studies, and which results are most helpful.
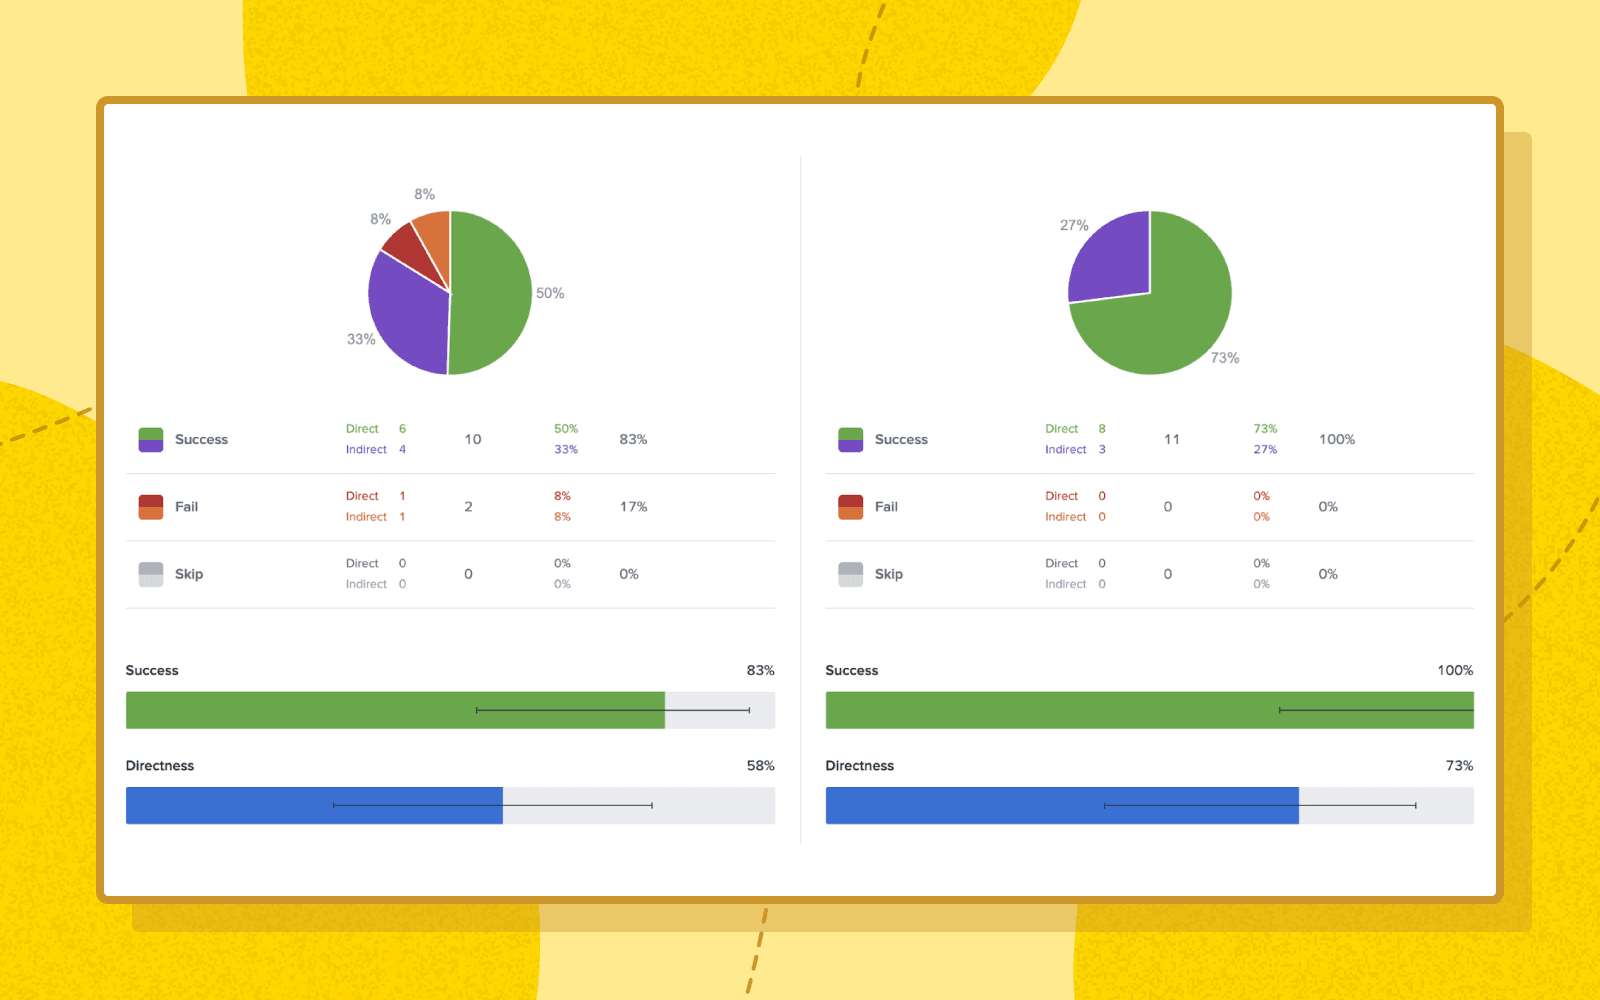
Testing and comparing multiple variations of trees will help you nail down an effective navigation structure before you implement it, saving time and costly mistakes. Treejack's comparison feature allows you to compare two tasks from two different Treejack studies without leaving the results page. It helps make comparing your variations easier and faster by putting results side-by-side for you to explore simultaneously.
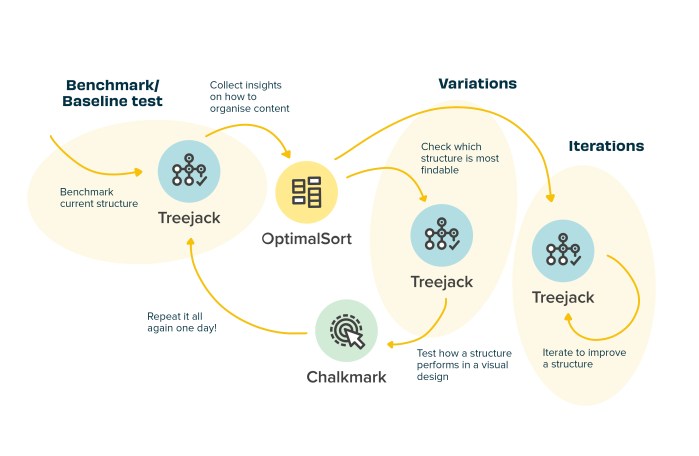
The image above shows a common workflow of how Optimal Workshop tools can be used together to improve your navigation structure.
First things first, sign into your Optimal Workshop account.
Open the tree test that you want to start your comparison from, then navigate to the Task Results tab in the Analysis section.
Click the ‘compare tasks’ button in your chosen task.
Next select the study and task you want to compare then click 'Compare tasks'.
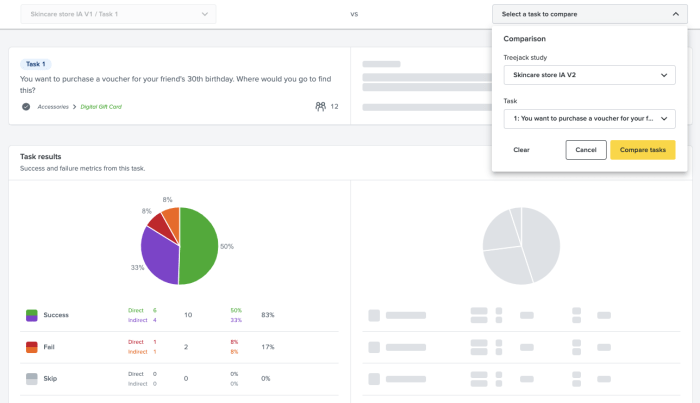
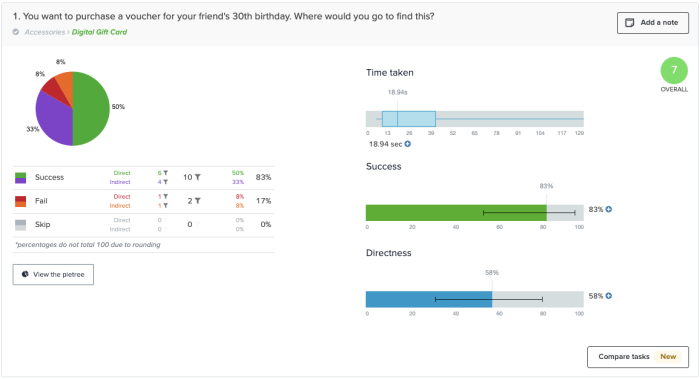
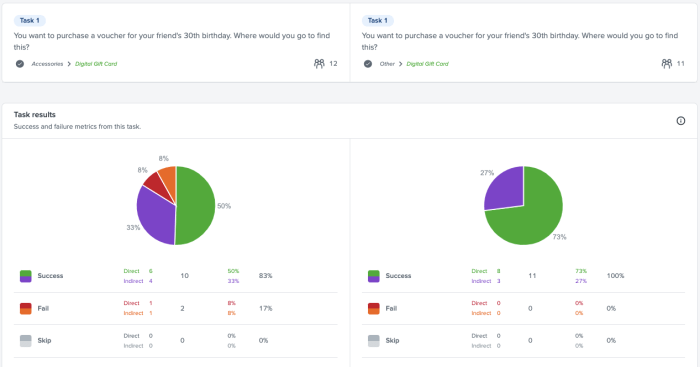
You can now compare the two tasks together and start the analysis process. Do this as many times, with as many tests and tasks, as you need to.
We’ve got a lot of exciting improvements in the pipeline and as always, we’d love your feedback. You can make feature requests, vote on existing requests and send feedback in Optimal Workshop using the Resource Centre. It's located at the bottom right hand corner of your account, just click the ? icon.
Log in now let us know what you think!

Are your visitors really getting the most out of your website? Tree testing (or sometimes referred to as reverse card sorting) takes away the guesswork by telling you how easily, or not, people can find information on your website. Discover why Treejack is the tool of choice for website architects.
Whether you’re building a website from scratch or improving an existing website, tree testing helps you design your website architecture with confidence. How? Tools like Treejack use analysis to help assess how findable your content is for people visiting your website.
It helps answer burning questions like:
Treejack provides invaluable intel for any Information Architect. Why? Knowing where and why people get lost trying to find your content, gives you a much better chance of fixing the actual problem. And the more easily people can find what they’re looking for, the better their experience which is ultimately better for everyone.
Tree testing can be broken down into two main parts:
Whether you’re new to tree testing or already a convert, effective tree testing using Treejack has some key steps.
Ask yourself what part of your information architecture needs improvement – is it your whole website or just parts of it? Also think about your audience, they’re the ones you’re trying to improve the website for so the more you know about their needs the better.
Tip: Make the most of what tree testing offers to improve your website by building it into your overall design project plan
You can build your tree using two main approaches:
Tip: Your category labels are known as ‘parent nodes’. Your information labels are known as ‘child nodes’.
The quality of your tasks will be reflected in the usefulness of your data so it’s worth making sure you create tasks that really test what you want to improve.
Tip: Use plain language that feels natural and try to write your tasks in a way that reflects the way people who visit your website might actually think when they are trying to find information on your site.
The quality of your data will largely depend on the quality of your participants. You want people who are as close to your target audience as possible and with the right attitude - willing and committed to being involved.
Tip: Consider offering some kind of incentive to participants – it shows you value their involvement.
Now for the fun part – making sense of the results. Treejack presents the data from your tree testing as a series of tables and visualizations. You can download them in a spreadsheet in their raw format or customized to your needs.
Tip: Use the results to gain quick, practical insights you can act on right away or as a starter to dive deeper into the data.
Tree testing is useful whenever you want to find out if your website content is labelled and organised in a way that’s easy to understand. What’s more it can be applied for any website, big (10+ levels with 10000s of labels) or small (3 levels and 22 labels) and any size in between. Our advice for using Treejack is simply this: test big, test small, test often.

Think about the last time you were visiting a friend or family member’s house and needed to find something. Like a spoon, for example. You start in the kitchen because that’s where we’ve all been trained to find things like spoons. But where do you look next? Some may look in the drawer near the dishwasher, while others may look to the drawer that’s by the cabinet that holds dishes and bowls. Point is, people use context clues and other points of reference (like familiarity and habits) to find things that they’re looking for.
The same goes for navigating a webpage.
However, unlike the spoon example, there’s much more variation in website structure than kitchen layout. Websites vary from industry to industry, ranging in purpose from ecommerce to digital portfolios and everything in between. So when someone lands on your website to find something or complete a task, is it obvious where they should go to get things done?
Your gut might tell you that it is. The people on your design team might tell you that it is too. But what really matters is what happens with actual users. Whenever you’re building a new website or optimizing an existing one, it’s important that you build it with quality user insights. That starts with user experience (UX) research.
And before you ask if we mean qualitative or quantitative research – the answer is both. Let’s explore a particular user research method that’s essential for gathering the information needed to build intuitive site navigation. It’s called tree testing.
For anyone unfamiliar with tree testing (sometimes referred to as ‘reverse card sorting’ or ‘card-based classification’), it’s a series of tests that help you understand where and why people get lost in your content.
It works by taking text-based versions of websites and stripping the influence of navigation aids or design elements to build a study. Participants are shown the text-only version of your website or app and are asked to indicate where they would find specific items or topics.
By removing everything but the labels and how they’re organized, you can work out just how effective your website structure is at enabling people to find what they need. If test participants consistently struggle to locate specific items, you’ll know there are issues with your structure. It can also help you visualize what paths participants take to get to specific site information.
Another point worth mentioning is that tree testing not only uncovers site navigation flaws, but it reveals word choice and microcopy that may not be clear to users. To reference back to the initial analogy, one person might say “where would I find your spoons,” while another may ask, “where do you keep your utensils?” So, tree testing can also be helpful for understanding which words work best in your site structure.
While it’s best to conduct a tree test early in the research phase of a project, there’s never a wrong time. (Unless that time is not at all). And if you have an existing website, this is a good time to establish a base of your existing site structure. The results you gather here can help to highlight any issues with your site’s structure and provide the data needed to compare to any improvements.
If you’re starting from scratch with a new website, you can run tree tests on different versions of your proposed site structure and then compare the results to determine which makes the most sense to your users.
Running a tree test is simple. You can use an online tool (like TreeJack) to collect all of the necessary quantitative data you need to ensure successful site navigation.

But what about the qualitative side of it all? We’re so glad you asked.
Running tree tests is a great way to gather quantitative data about your site navigation and topic findability, but it's not so good at providing you with qualitative insights, or why people are looking for information the way that they are.
Traditionally, you could get your gift cards ready and set up an in-person study where you watch people perform the tasks laid out in your tree test, and subsequently ask why they searched for things the way they did. But that takes a lot of time, coordination, and compensation. Alternatively, you could set up a remote usability test using a platform designed to record users as they complete your tree test.
This way, you’ll get the quantitative results you need to make decisions, backed by qualitative insights from real people. You’ll be able to set up your test to get answers to questions like:
Teams that solely rely on quantitative data are only getting half the story. By pairing tree testing tools, like Optimal Workshop’s Treejack, with UserTesting’s Human Insight Platform, researchers are able to not only see how people search for information on a website but get to the bottom of why. When used together, quantitative and qualitative data reveal the most valuable insights for tree testing.
Every day, people around the world use our research tools to craft better experiences for their users. Whether it’s a website for a new public library, an app for a self-driving car startup or even the layout of a physical retail store, our tools give researchers and designers everything they need to ensure the way people work, think and act are at the heart of every design decision.
We talk about our tools on a fairly regular basis (after all, we are quite proud of them), but this time we’re going to do something a little different. Here, we’re going to show you 17 creative ways to use OptimalSort, Treejack, Chalkmark, Reframer and Questions. Hopefully, we’ll inspire you to head off and start doing some more testing of your own. Let’s get started!
Tree testing is one of the best methods to assess the strength of your navigation structure, and Treejack is the best tool to execute this method. You can easily set up more than one Treejack study to run at the same time, allowing you to A/B test different navigation structures and pick a winner.
Ever struggle to get consensus from your team on a new logo or design? Use OptimalSort to solve the problem! Create a closed image sort with categories set up so your team can sort designs based on their preferences. You can then look at the results and determine the best path forward.
Reframer is a powerful qualitative research tool, and most of what makes it so useful for usability tests and user interviews also makes it a great tool for taking notes at conferences. Once you’ve taken all of your notes, you can use tags to mark up different insights and then share the results with your coworkers.
Card sorting is a great way to work out if you have any redundant content on your landing pages. Let’s use the example of simplifying your homepage. You can ask participants to sort cards (containing homepage links) based on how often they use them. You could then compare this data with analytics from your homepage and see if people’s actual behavior and perception are well aligned.
Determine if your icons are helping your users by testing whether they understand their purpose. Upload icons that you’re currently using (or even plan to use) to Chalkmark, and ask your participants to identify their meaning by using the post-task questions feature.
Card sorting isn’t just a technique for the digital realm. Run an open card sort with OptimalSort to figure out where items in a retail store should be grouped. If we use the example of a supermarket, the cards would be different food items and the ‘aisles’ would be the categories.
You can use Questions as a scheduling tool by setting up a survey designed to ask people which times they’re available to come in for usability testing sessions. You can send out one link to every participant and view the results in a single location. Easy!
Did you know you can use our integrated recruitment panel to remotely research participants from all around the world? This is a great way to see how different languages, countries, cultures and backgrounds interact with your website.
Chalkmark’s heatmap feature is an excellent way to get first impressions on your designs. You can see where your users clicked so you can get insights into what’s working (or not working) with your designs. It’s also fast, so it’s easy to iterate.
Empathy tests are a great way to find out whether your website, app or design is creating the right feelings with your users. Set up a closed card sort with a list of the words which could represent your design, then set up categories based on relevance. Show people your design and then ask them to sort the words into the categories which best match the experience.
The number of people using smartphones to browse websites continues to grow, making the UX of mobile websites key. Use Treejack to test the mobile IA of your website so you can work out if people are getting stuck.
Use first-click testing to find out if a text link or an icon is the best choice for navigating back to the homepage of your website. A quick test in Chalkmark will improve your website and save you design work down the line!
Ever heard of multivariate testing? It’s not too complicated. Basically, you just compare more than two versions of your studies to understand which version performs better with your audience. You can run this type of testing with Chalkmark and Treejack to determine the right design to iterate on.
Yep, you heard us. Running a card sort asking people which toppings are good for pizza and which ones aren’t is a great way to introduce people to the benefits of the card sorting method. Plus, it’s always fun to show off the results on a Friday afternoon in the office.
Search engine optimization (SEO) is an important part of any modern website, with an SEO-tuned website much more likely to show up in search results. There are many factors that go into SEO, but one of the most important is a website’s navigation. Use Treejack to improve how people navigate through your website and you’ll likely see your search engine ranking improve.
Login to your Optimal Workshop account on your laptop and get out into the field with Reframer! When you’re out conducting usability tests or user interviews with people away from your office, having Reframer makes it much easier to collect all of the necessary data. Once you’re back, use Reframer’s analysis features to make sense of your findings.
How are you supposed to test your paper prototypes when your users are spread all around the world? Well, you can simply take a photo of your prototype and use Chalkmark to remote test it with your users. Easy.
So that’s our list of 17 creative ways to use our tools. Have you got any of your own? If you do, don’t hesitate to click the little Intercom chat bubble in the corner of your screen and let us know! We always love to hear from you.
If you haven’t yet had the chance to play around with our 5 tools, you can try them for free - forever - by signing up here (no credit card required). Don’t just take our word for it, either. Check out these case studies from Xero and Intercom to learn about how 2 organizations managed to significantly improve different areas of their businesses.
