Taylor Swift's music has captivated millions, but what do her fans really think about her extensive catalog? We've crunched the numbers, analyzed the data, and uncovered some fascinating insights into how Swifties perceive and categorize their favorite artist's work. Let's dive in!
The great debate: openers, encores, and everything in between ⋆.˚✮🎧✮˚.⋆
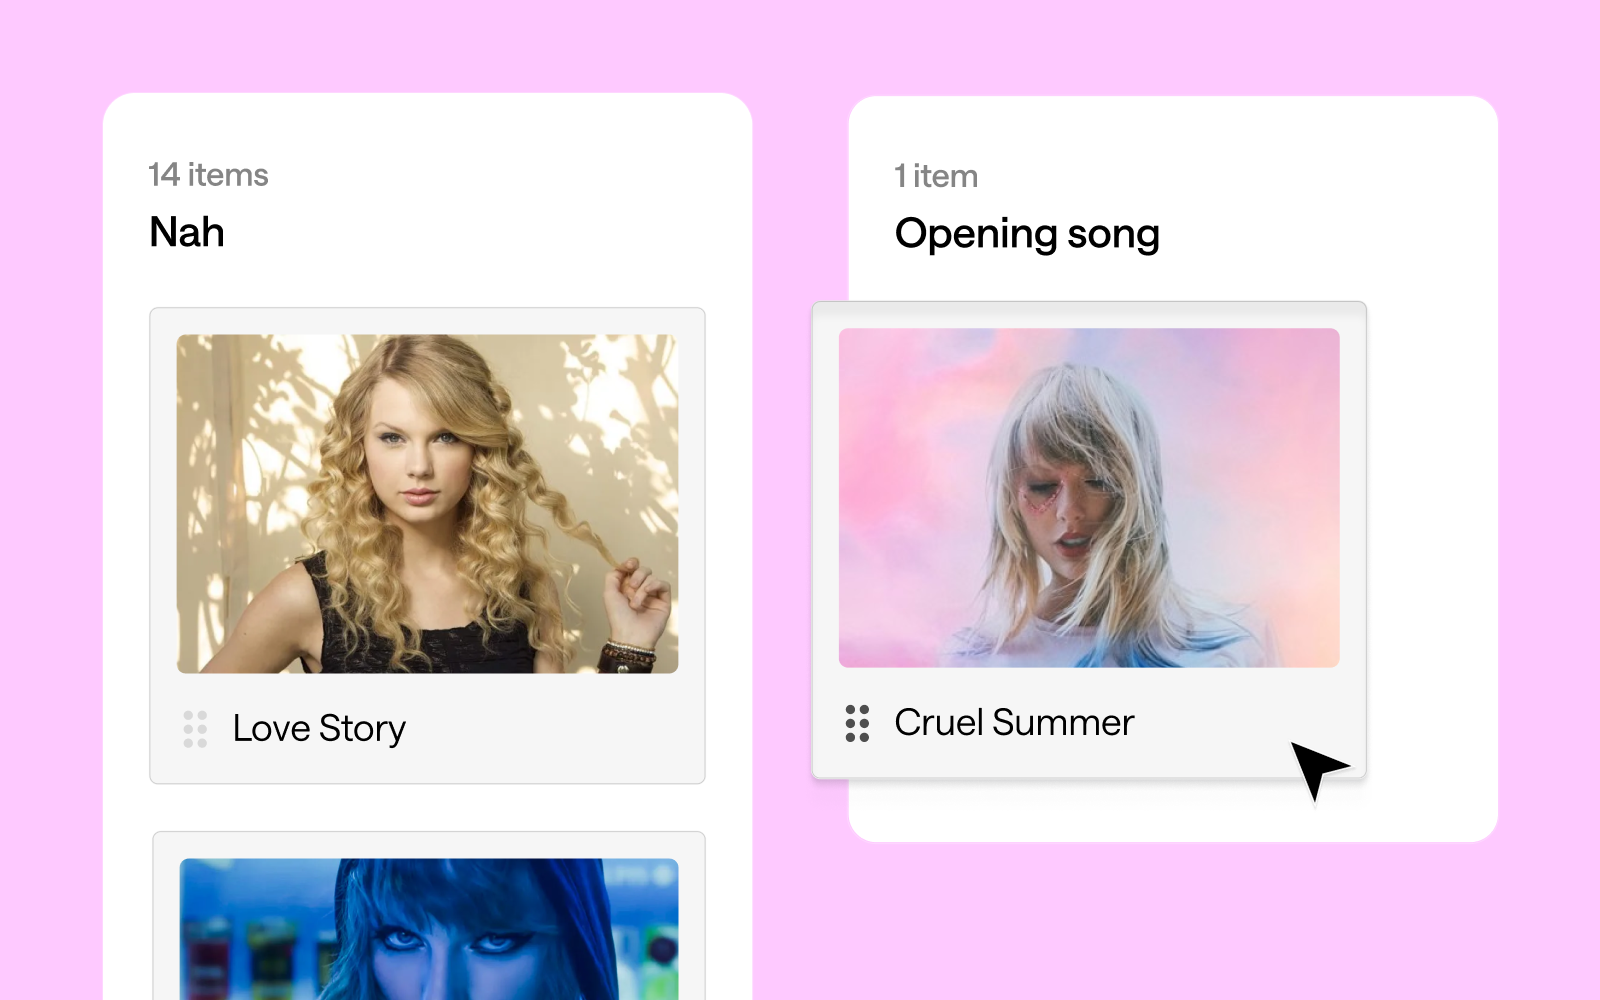
Our study asked fans to categorize Swift's songs into potential opening numbers, encores, and songs they'd rather not hear (affectionately dubbed "Nah" songs). The results? As diverse as Swift's discography itself!
Opening with a bang 💥
Swifties seem to agree that high-energy tracks make for the best concert openers, but the results are more nuanced than previously suggested. "Shake It Off" emerged as the clear favorite for opening a concert, with 17 votes. "Love Story" follows closely behind with 14 votes, showing that nostalgia indeed plays a significant role. Interestingly, both "Cruel Summer" and "Blank Space" tied for third place with 13 votes each.
This mix of songs from different eras of Swift's career suggests that fans appreciate both her newer hits and classic favorites when it comes to kicking off a show. The strong showing for "Love Story" does indeed speak to the power of nostalgia in concert experiences. It's worth noting that "...Ready for It?", while a popular song, received fewer votes (9) for the opening slot than might have been expected.

Encore extravaganza 🎤
When it comes to encores, fans seem to favor a diverse mix of Taylor Swift's discography, with a surprising tie at the top. "Slut!" (Taylor's Version), "exile", "Guilty as Sin?", and "Bad Blood (Remix)" all received the highest number of votes with 13 each. This variety showcases the breadth of Swift's career and the different aspects of her artistry that resonate with fans for a memorable show finale.
Close behind are "evermore", "Wildest Dreams", "ME!", "Love Story", and "Lavender Haze", each garnering 12 votes. It's particularly interesting to see both newer tracks and classic hits like "Love Story" maintaining strong popularity for the encore slot. This balance suggests that Swifties appreciate both nostalgia and Swift's artistic evolution when it comes to closing out a concert experience.

The "Nah" list 😒
Interestingly, some of Taylor Swift's tracks found themselves on the "Nah" list, indicating that fans might prefer not to hear them in a concert setting. "Clara Bow" tops this category with 13 votes, closely followed by "You're On Your Own, Kid", "You're Losing Me", and "Delicate", each receiving 12 votes.
This doesn't necessarily mean fans dislike these songs - they might just feel they're not well-suited for live performances or don't fit as well into a concert setlist. It's particularly surprising to see "Delicate" on this list, given its popularity. The presence of both newer tracks like "Clara Bow" and older ones like "Delicate" suggests that the "Nah" list isn't tied to a specific era of Swift's career, but rather to individual song preferences in a live concert context.
It's worth noting that even popular songs can end up on this list, highlighting the complex relationship fans have with different tracks in various contexts. This data provides an interesting insight into how Swifties perceive songs differently when considering them for a live performance versus general listening.

The Similarity Matrix: set list synergies ⚡
Our similarity matrix revealed fascinating insights into how fans envision Taylor Swift's songs fitting together in a concert set list:
1. The "Midnights" Connection: Songs from "Midnights" like "Midnight Rain", "The Black Dog", and "The Tortured Poets Department" showed high similarity in set list placement. This suggests fans see these tracks working well in similar parts of a concert, perhaps as a cohesive segment showcasing the album's distinct sound.
2. Cross-album transitions: There's an intriguing connection between "Guilty as Sin?" and "exile", with a high similarity percentage. This indicates fans see these songs from different albums as complementary in a live setting, potentially suggesting a smooth transition point in the set list that bridges different eras of Swift's career.
3. The show-stoppers: "Shake It Off" stands out as dissimilar to most other songs in terms of placement. This likely reflects its perceived role as a high-energy, statement piece that occupies a unique position in the set list, perhaps as an opener, closer, or peak moment.
4. Set list evolution: There's a noticeable pattern of higher similarity between songs from the same or adjacent eras, suggesting fans envision distinct segments for different periods of Swift's career within the concert. This could indicate a preference for a chronological journey through her discography or strategic placement of different styles throughout the show.
5. Thematic groupings: Some songs from different albums showed higher similarity, such as "Is It Over Now? (Taylor's Version)" and "You're On Your Own, Kid". This suggests fans see them working well together in the set list based on thematic or emotional connections rather than just album cohesion.
What does it all mean?! 💃🏼📊
This card sort data paints a picture of an artist who continually evolves while maintaining certain core elements that define her work. Swift's ability to create cohesive album experiences, make bold stylistic shifts, and maintain thematic threads throughout her career is reflected in how fans perceive and categorize her songs. Moreover, the diversity of opinions on song categorization - with 59 different songs suggested as potential openers - speaks to the depth and breadth of Swift's discography. It also highlights the personal nature of music appreciation; what one fan sees as the perfect opener, another might categorize as a "Nah".
In the end, this analysis gives us a fascinating glimpse into the complex web of associations in Swift's discography. It shows us not just how Swift has evolved as an artist, but how her fans have evolved with her, creating deep and sometimes unexpected connections between songs across her entire career. Whether you're a die-hard Swiftie or a casual listener, or a weirdo who just loves a good card sort, one thing is clear: Taylor Swift's music is rich, complex, and deeply meaningful to her fans. And with each new album, she continues to surprise, delight, and challenge our expectations.
Conclusion: shaking up our understanding 🥤🤔
This deep dive into the Swiftie psyche through a card sort reveals the complexity of Taylor Swift's discography and fans' relationship with it. From strategic song placement in a dream setlist to unexpected cross-era connections, we've uncovered layers of meaning that showcase Swift's artistry and her fans' engagement. The exercise demonstrates how a song can be a potential opener, mid-show energy boost, poignant closer, or a skip-worthy track, highlighting Swift's ability to create diverse, emotionally resonant music that serves various roles in the listening experience.
The analysis underscores Swift's evolving career, with distinct album clusters alongside surprising connections, painting a picture of an artist who reinvents herself while maintaining a core essence. It also demonstrates how fan-driven analyses like card sorting can be insightful and engaging, offering a unique window into music fandom and reminding us that in Swift's discography, there's always more to discover. This exercise proves valuable whether you're a die-hard Swiftie, casual listener, or someone who loves to analyze pop culture phenomena.