How to interpret your card sort results Part 2: closed card sorts and next steps
In Part 1 of this series we looked at how to interpret results from open and hybrid card sorts and now in Part 2, we’re going to talk about closed card sorts. In closed card sorts, participants are asked to sort the cards into predetermined categories and are not allowed to create any of their own. You might use this approach when you are constrained by specific category names or as a quick checkup before launching a new or newly redesigned website.In Part 1, we also discussed the two different - but complementary - types of analysis that are generally used together for interpreting card sort results: exploratory and statistical. Exploratory analysis is intuitive and creative while statistical analysis is all about the numbers. Check out Part 1 for a refresher or learn more about exploratory and statistical analysis in Donna Spencer’s book.
Getting started
Closed card sort analysis is generally much quicker and easier than open and hybrid card sorts because there are no participant created category names to analyze - it’s really just about where the cards were placed. There are some similarities about how you might start to approach your analysis process but overall there’s a lot less information to take in and there isn’t much in the way of drilling down into the details like we did in Part 1.Just like with an open card sort, kick off your analysis process by taking an overall look at the results as a whole. Quickly cast your eye over each individual card sort and just take it all in. Look for common patterns in how the cards have been sorted. Does anything jump out as surprising? Are there similarities or differences between participant sorts?
If you’re redesigning an existing information architecture (IA), how do your results compare to the current state? If this is a final check up before launching a live website, how do these results compare to what you learned during your previous research studies?If you ran your card sort using information architecture tool OptimalSort, head straight to the Overview and Participants Table presented in the results section of the tool. If you ran a moderated card sort using OptimalSort’s printed cards, you’ve probably been scanning them in after each completed session, but now is a good time to double check you got them all. And if you didn’t know about this handy feature of OptimalSort, it’s something to keep in mind for next time!
The Participants Table shows a breakdown of your card sorting data by individual participant. Start by reviewing each individual card sort one by one by clicking on the arrow in the far left column next to the Participants numbers. From here you can easily flick back and forth between participants without needing to close that modal window. Don’t spend too much time on this — you’re just trying to get a general impression of how the cards were sorted into your predetermined categories. Keep an eye out for any card sorts that you might like to exclude from the results. For example participants who have lumped everything into one group and haven’t actually sorted the cards.
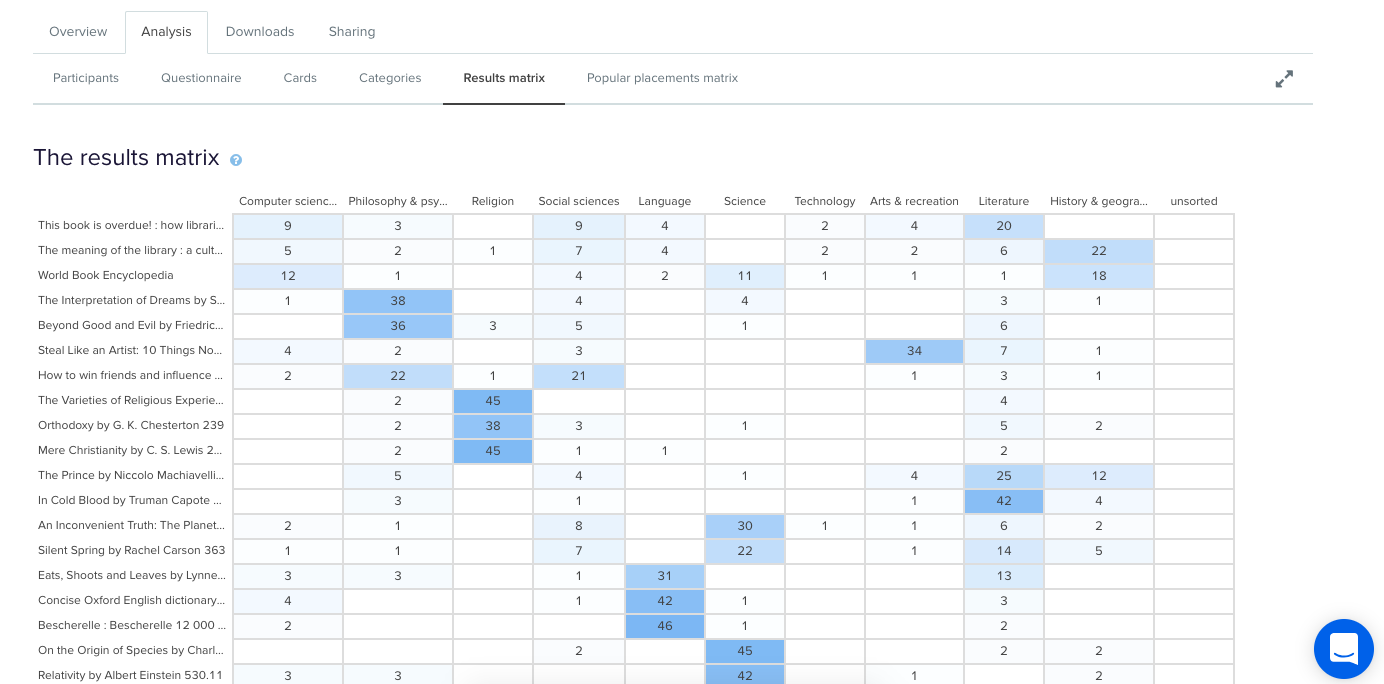
Don’t worry- excluding or including participants isn’t permanent and can be toggled on or off at anytime.Once you’re happy with the individual card sorts that will and won’t be included in your results visualizations, it’s time to take a look at the Results Matrix in OptimalSort. The Results Matrix shows the number of times each card was sorted into each of your predetermined categories- the higher the number, the darker the shade of blue (see below).
Results Matrix in OptimalSort.
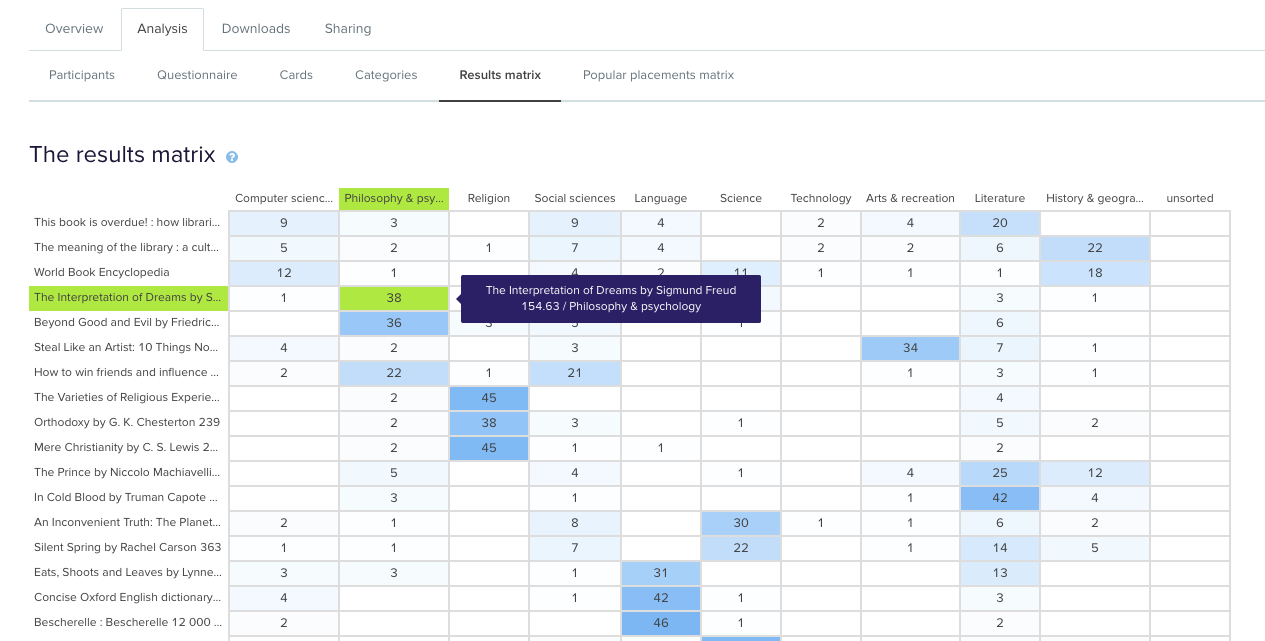
This table enables you to quickly and easily get across how the cards were sorted and gauge the highest and lowest levels of agreement among your participants. This will tell you if you’re on the right track or highlight opportunities for further refinement of your categories.If we take a closer look (see below) we can see that in this example closed card sort conducted on the Dewey Decimal Classification system commonly used in libraries, The Interpretation of Dreams by Sigmund Freud was sorted into ‘Philosophy and psychology’ 38 times in study a completed by 51 participants.
Results Matrix in OptimalSort zoomed in with hover.
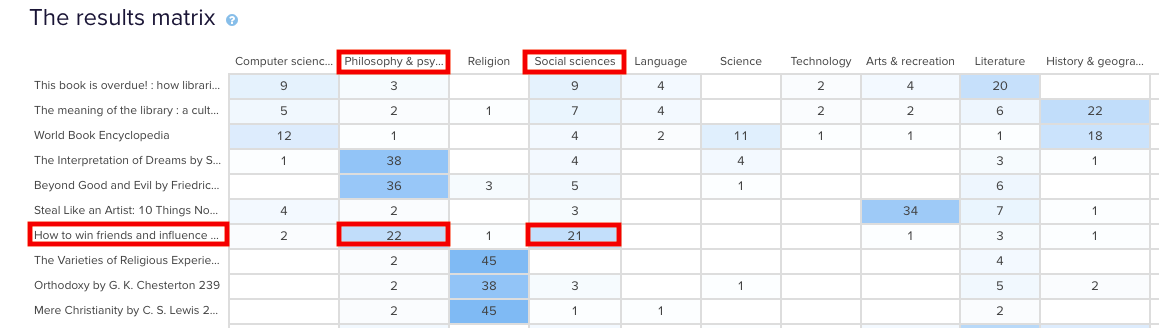
In the real world, that is exactly where that content lives and this is useful to know because it shows that the current state is supporting user expectations around findability reasonably well. Note: this particular example study used image based cards instead of word label based cards so the description that appears in both the grey box and down the left hand side of the matrix is for reference purposes only and was hidden from the participants.Sometimes you may come across cards that are popular in multiple categories. In our example study, How to win friends and influence people by Dale Carnegie, is popular in two categories: ‘Philosophy & psychology’ and ‘Social sciences’ with 22 and 21 placements respectively. The remaining card placements are scattered across a further 5 categories although in much smaller numbers.
Results Matrix showing cards popular in multiple categories.
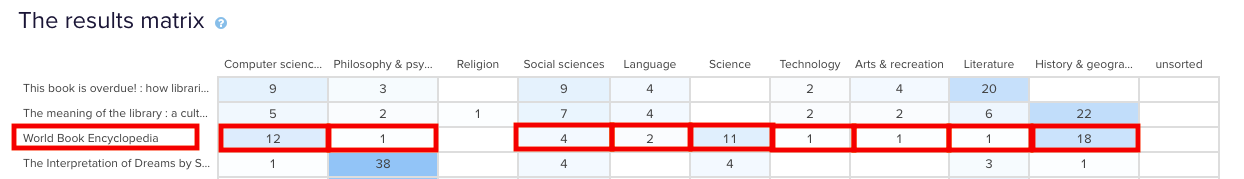
When this happens, it’s up to you to determine what your number thresholds are. If it’s a tie or really close like it is in this case, you might review the results against any previous research studies to see if anything has changed or if this is something that comes up often. It might be a new category that you’ve just introduced, it might be an issue that hasn’t been resolved yet or it might just be limited to this one study. If you’re really not sure, it’s a good idea to run some in-person card sorts as well so you can ask questions and gain clarification around why your participants felt a card belonged in a particular category. If you’ve already done that great! Time to review those notes and recordings!You may also find yourself in a situation where no category is any more popular than the others for a particular card. This means there’s not much agreement among your participants about where that card actually belongs. In our example closed card sort study, the World Book Encyclopedia was placed into 9 of 10 categories. While it was placed in ‘History & geography’ 18 times, that’s still only 35% of the total placements for that card- it’s hardly conclusive.
Results Matrix showing a card with a lack of agreement.
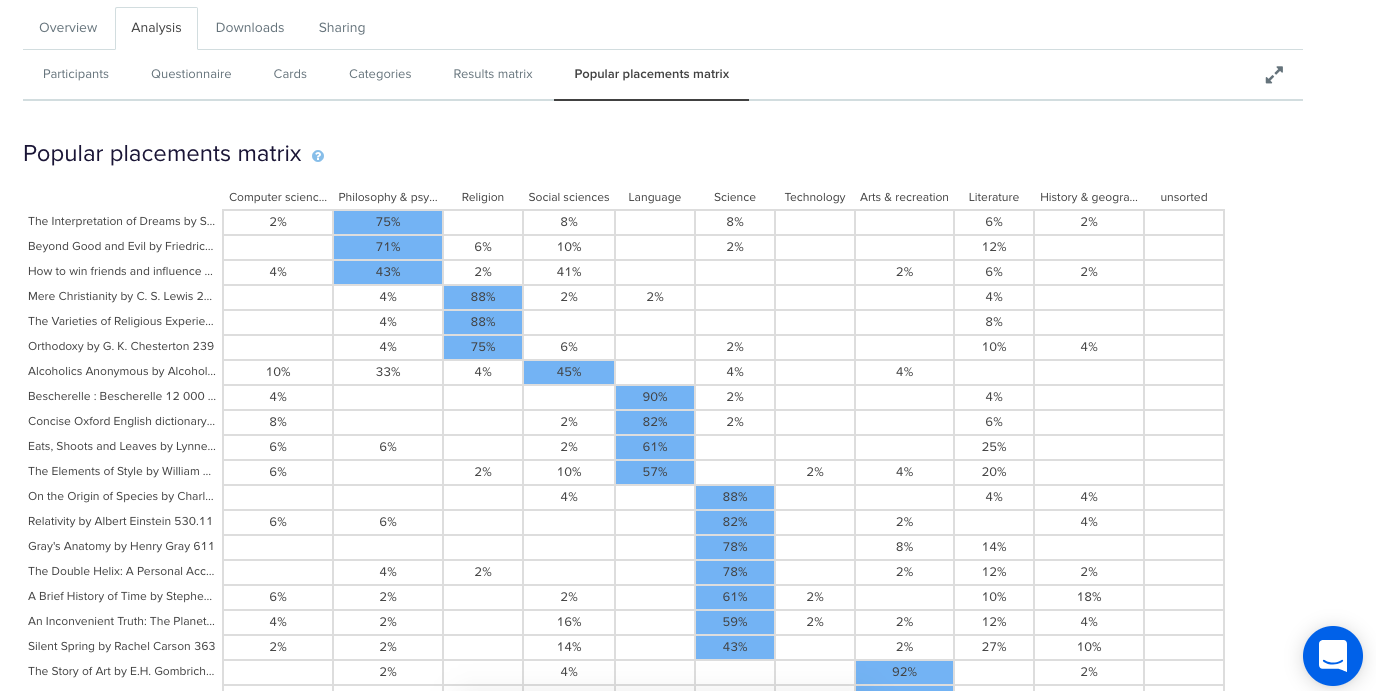
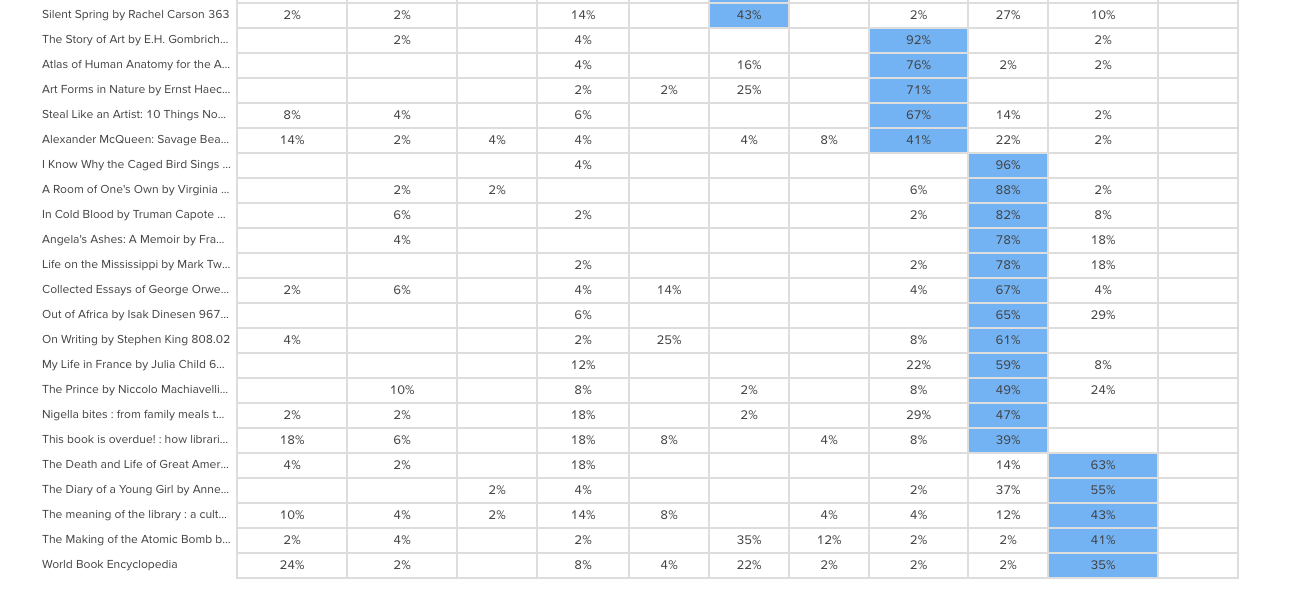
Sometimes this happens when the card label or image is quite general and could logically belong in many of the categories. In this case, an encyclopedia could easily fit into any of those categories and I suspect this happened because people may not be aware that encyclopedias make up a very large part of the category on the far left of the above matrix: ‘Computer science, information & general works’. You may also see this happening when a card is ambiguous and people have to guess where it might belong. Again - if you haven’t already - if in doubt, run some in-person card sorts so you can ask questions and get to the bottom of it!After reviewing the Results Matrix in OptimalSort, visit the Popular Placements Matrix to see which cards were most popular for each of your categories based on how your participants sorted them (see below 2 images).
Popular Placements Matrix in OptimalSort- top half of the diagram.
Popular Placements Matrix in OptimalSort- scrolled to show the bottom half of the diagram.
The diagram shades the most popular placements for each category in blue making it very easy to spot what belongs where in the eyes of your participants. It’s useful for quickly identifying clusters and also highlights the categories that didn’t get a lot of card sorting love. In our example study (2 images above) we can see that ‘Technology’ wasn’t a popular card category choice potentially indicating ambiguity around that particular category name. As someone familiar with the Dewey Decimal Classification system I know that ‘Technology’ is a bit of a tricky one because it contains a wide variety of content that includes topics on medicine and food science - sometimes it will appear as ‘Technology & applied sciences’. These results appear to support the case for exploring that alternative further!
Where to from here?
Now that we’ve looked at how to interpret your open, hybrid and closed card sorts, here are some next steps to help you turn those insights into action!Once you’ve analyzed your card sort results, it’s time to feed those insights into your design process and create your taxonomy which goes hand in hand with your information architecture. You can build your taxonomy out in Post-it notes before popping it into a spreadsheet for review. This is also a great time to identify any alternate labelling and placement options that came out of your card sorting process for further testing.From here, you might move into tree testing your new IA or you might run another card sort focussing on a specific area of your website. You can learn more about card sorting in general via our 101 guide.
When interpreting card sort results, don’t forget to have fun! It’s easy to get overwhelmed and bogged down in the results but don’t lose sight of the magic that is uncovering user insights.I’m going to leave you with this quote from Donna Spencer that summarizes the essence of card sort analysis quite nicely:Remember that you are the one who is doing the thinking, not the technique... you are the one who puts it all together into a great solution. Follow your instincts, take some risks, and try new approaches. - Donna Spencer
Further reading
Card Sorting 101 – Learn about the differences between open, closed and hybrid card sorts, and how to run your own using OptimalSort.
Your cards have been sorted, and now you have lots of amazing data and insight to help improve your information architecture. So how do you interpret the results?
Never fear, our product ninjas Alex and Aidan are here to help. In our latest live training session they take you on a walk-through of card sort analysis using OptimalSort.
What they cover:
Use cases for open, closed and hybrid card sort methodologies
How, when and why to standardize categories
How to interpret 3D cluster views, dendrograms, and similarity matrix
Tips on turning those results into actionable insights
“Dear Optimal, I want to test the structure of a university website (well certain sections anyway). My gut instinct is that it's pretty 'broken'. Lots of sections feel like they're in the wrong place. I want to test my hypotheses before proposing a new structure. I'm definitely going to do some card sorting, and was planning a mixture of online and offline. My question is about when to bring in tree testing. Should I do this first to test the existing IA? Or is card sorting sufficient? I do intend to tree test my new proposed IA in order to validate it, but is it worth doing it upfront too?" — Matt
Dear Matt,
Ah, the classic chicken or the egg scenario: Which should come first, tree testing or card sorting? It’s a question that many researchers often ask themselves, but I’m here to help clear the air! You should always use both methods when changing up your information architecture (IA) in order to capture the most information.
Tree testing and card sorting, when used together, can give you fantastic insight into the way your users interact with your site. First of all, I’ll run through some of the benefits of each testing method.
What is card sorting and why should I use it?
Card sorting is a great method to gauge the way in which your users organize the content on your site. It helps you figure out which things go together and which things don’t. There are two main types of card sorting: open and closed.
Closed card sorting involves providing participants with pre-defined categories into which they sort their cards. For example, you might be reorganizing the categories for your online clothing store for women. Your cards would have all the names of your products (e.g., “socks”, “skirts” and “singlets”) and you also provide the categories (e.g.,“outerwear”, “tops” and “bottoms”).
Open card sorting involves providing participants with cards and leaving them to organize the content in a way that makes sense to them. It’s the opposite to closed card sorting, in that participants dictate the categories themselves and also label them. This means you’d provide them with the cards only, and no categories.
Card sorting, whether open or closed, is very user focused. It involves a lot of thought, input, and evaluation from each participant, helping you to form the structure of your new IA.
What is tree testing and why should I use it?
Tree testing is a fantastic way to determine how your users are navigating your site and how they’re finding information. Your site is organized into a tree structure, sorted into topics and subtopics, and participants are provided with some tasks that they need to perform. The results will show you how your participants performed those tasks, if they were successful or unsuccessful, and which route they took to complete the tasks. This data is extremely useful for creating a new and improved IA.
Tree testing is an activity that requires participants to seek information, which is quite the contrast to card sorting. Card sorting is an activity that requires participants to sort and organize information. Each activity requires users to behave in different ways, so each method will give its own valuable results.
Comparing tree testing and card sorting: Key differences
Tree testing and card sorting are complementary methods within your UX toolkit, each unlocking unique insights about how users interact with your site structure. The difference is all about direction.
Card sorting is generative. It helps you understand how users naturally group and label your content; revealing mental models, surfacing intuitive categories, and informing your site’s information architecture (IA) from the ground up. Whether using open or closed methods, card sorting gives users the power to organize content in ways that make sense to them.
Tree testing is evaluative. Once you’ve designed or restructured your IA, tree testing puts it to the test. Participants are asked to complete find-it tasks using only your site structure – no visuals, no design – just your content hierarchy. This highlights whether users can successfully locate information and how efficiently they navigate your content tree.
In short:
Card sorting = "How would you organize this?"
Tree testing = "Can you find this?"
Using both methods together gives you clarity and confidence. One builds the structure. The other proves it works.
Which method should you choose?
The right method depends on where you are in your IA journey. If you're beginning from scratch or rethinking your structure, starting with card sorting is ideal. It will give you deep insight into how users group and label content.
If you already have an existing IA and want to validate its effectiveness, tree testing is typically the better fit. Tree testing shows you where users get lost and what’s working well. Think of card sorting as how users think your site should work, and tree testing as how they experience it in action.
Should you run a card or tree test first?
In this scenario, I’d recommend running a tree test first in order to find out how your existing IA currently performs. You said your gut instinct is telling you that your existing IA is pretty “broken”, but it’s good to have the data that proves this and shows you where your users get lost.
An initial tree test will give you a benchmark to work with – after all, how will you know your shiny, new IA is performing better if you don’t have any stats to compare it with? Your results from your first tree test will also show you which parts of your current IA are the biggest pain points and from there you can work on fixing them. Make sure you keep these tasks on hand – you’ll need them later!
Once your initial tree test is done, you can start your card sort, based on the results from your tree test. Here, I recommend conducting an open card sort so you can understand how your users organize the content in a way that makes sense to them. This will also show you the language your participants use to name categories, which will help you when you’re creating your new IA.
Finally, once your card sort is done you can conduct another tree test on your new, proposed IA. By using the same (or very similar) tasks from your initial tree test, you will be able to see that any changes in the results can be directly attributed to your new and improved IA.
Once your test has concluded, you can use this data to compare the performance from the tree test for your original information architecture.
Why using both methods together is most effective
Card sorting and tree testing aren’t rivals, view them as allies. Used together, they give you end-to-end clarity. Card sorting informs your IA design based on user mental models. Tree testing evaluates that structure, confirming whether users can find what they need. This combination creates a feedback loop that removes guesswork and builds confidence. You'll move from assumptions to validation, and from confusion to clarity – all backed by real user behavior.
Hello, my name is Rick and I’m a sociologist. All together, “Hi, Rick!” Now that we’ve got that out of the way, let me tell you about how I use card sorting in my research. I'll soon be running a series of in-person, moderated card sorting sessions. This article covers why card sorting is an integral part of my research, and how I've designed the study toanswer specific questions about two distinct parts of society.
Card sorting to establish how different people comprehend their worlds
Card sorting,or pile sorting as it’s sometimes called, has a long history in anthropology, psychology and sociology. Anthropologists, in particular, have used it to study how different cultures think about various categories. Researchers in the 1970s conducted card sorts to understand how different cultures categorize things like plants and animals. Sociologists of that era also used card sorts to examine how people think about different professions and careers. And since then, scholars have continued to use card sorts to learn about similar categorization questions.
In my own research, I study how different groups of people in the United States imagine the category of 'religion'. Asthose crazy 1970s anthropologists showed, card sorting is a great way to understand how people cognitively understand particular social categories. So, in particular,I’m using card sorting in my research to better understand how groups of people with dramatically different views understand 'religion' — namely, evangelical Christians and self-identified atheists. Thinkof it like this. Some people say that religion is the bedrock of American society.
Others say that too much religion in public life is exactly what’s wrong with this country. What's not often considered is these two groups oftenunderstand the concept of 'religion' in very different ways. It’s like the group of blind men and the elephant: one touches the trunk, one touches the ears, and one touches the tail. All three come away with very different ideas of what an elephant is. So you could say that I study how different people experience the 'elephant' of religion in their daily lives. I’m doing so using primarily in-person moderated sorts on an iPad, which I’ll describe below.
How I generated the words on the cards
The first step in the process was to generate lists of relevant terms for my subjects to sort. Unlike in UX testing, where cards for sorting might come from an existing website, in my world these concepts first have to be mined from the group of people being studied. So the first thing I did was have members of both atheist and evangelical groups complete a free listing task. In a free listing task, participants simply list as many words as they can that meet the criteria given. Sets of both atheist and evangelical respondents were given the instructions: "What words best describe 'religion?' Please list as many as you can.” They were then also asked to list words that describe 'atheism', 'spirituality', and 'Christianity'.
I took the lists generated and standardizedthem by combining synonyms. For example, some of my atheists used words like 'ancient', 'antiquated', and 'archaic' to describe religion. SoI combined all of these words into the one that was mentioned most: 'antiquated'. By doing this, I created a list of the most common words each group used to describe each category. Doing this also gave my research another useful dimension, ideal for exploring alongside my card sorting results. Free lists can beanalyzed themselves using statistical techniques likemulti-dimensional scaling, so I used this technique for apreliminary analysis of the words evangelicals used to describe 'atheism':
Now that I’m armed with these lists of words that atheist and evangelicals used to describe religion, atheism etc., I’m about to embark on phase two of the project: the card sort.
Why using card sorting software is a no-brainer for my research
I’ll be conducting my card sorts in person, for various reasons. I have relatively easy access to the specific population that I’m interested in, and for the kind of academic research I’m conducting, in-person activities are preferred. In theory, I could just print the words on some index cards and conduct a manual card sort, but I quickly realized that a software solution would be far preferable, for a bunch of reasons.
First of all, it's important for me to conductinterviews in coffee shops and restaurants, and an iPad on the table is, to put it mildly, more practical than a table covered in cards — no space for the teapot after all.
Second, usingsoftwareeliminates the need for manual data entry on my part. Not only is manual data entry a time consuming process, but it also introduces the possibly of data entry errors which may compromise my research results.
Third, while the bulk of the card sorts are going to be done in person, having an online version will enable meto scale the project up after the initial in-person sorts are complete. The atheist community, in particular, has a significant online presence, making a web solution ideal for additional data collection.
Fourth, OptimalSort gives the option to re-direct respondents after they complete a sort to any webpage, which allows multiple card sorts to be daisy-chained together. It also enables card sorts to be easily combined with complex survey instruments from other providers (e.g. Qualtrics or Survey Monkey), so card sorting data can be gathered in conjunction with other methodologies.
Finally, and just as important, doing card sorts on a tablet is more fun for participants. After all, who doesn’t like to play with an iPad? If respondents enjoy the unique process of the experiment, this is likely to actually improve the quality of the data, andrespondents are more likely to reflect positively on the experience, making recruitment easier. And a fun experience also makes it more likely that respondents will complete the exercise.
What my in-person, on-tablet card sorting research will look like
Respondents will be handed an iPad Air with 4G data capability. While the venues where the card sorts will take place usually have public Wi-Fi networks available, these networks are not always reliable, so the cellular data capabilities are needed as a back-up (and my pre-testing has shown that OptimalSort works on cellular networks too).
The iPad’s screen orientation will be locked to landscape and multi-touch functions will be disabled to prevent respondents from accidentally leaving the testing environment. In addition, respondents will have the option of using a rubber tipped stylus for ease of sorting the cards. While I personally prefer to use a microfiber tipped stylus in other applications, pre-testing revealed that an old fashioned rubber tipped stylus was easier for sorting activities.
When the respondent receives the iPad, the card sort first page with general instructions will already be open on the tablet in the third party browser Perfect Web. A third party browser is necessary because it is best to run OptimalSort locked in a full screen mode, both for aesthetic reasons and to keep the screen simple and uncluttered for respondents. Perfect Web is currently the best choice in the ever shifting app landscape.
I'll give respondents their instructions and then go to another table to give them privacy (because who wants the creepy feeling of some guy hanging over you as you do stuff?). Altogether, respondents will complete two open card sorts and a fewsurvey-style questions, all chained together by redirect URLs. First, they'll sort 30 cards into groups based on how they perceive 'religion', and name the categories they create. Then, they'll complete a similar card sort, this time based on how they perceive 'atheism'.
Both atheist and evangelicals will receive a mixture of some of the top words that both groups generated in the earlier free listing tasks. To finish, they'll answer a few questions that will provide further data on how they think about 'religion'. After I’ve conducted these card sorts with both of my target populations, I’ll analyze the resulting data on its own and also in conjunction with qualitative data I’ve already collected via ethnographic research and in-depth interviews. I can't wait, actually. In a few months I’ll report back and let you know what I’ve found.