Subscribe to OW blog for an instantly better inbox
Oops! Something went wrong while submitting the form.
Articles and Podcasts on Customer Service, AI and Automation, Product, and more
.webp)
Nearly 18 years ago, Optimal helped define what UX research could be, pioneering practices and tools that would become industry standard and change how teams worldwide better understand their users. As the industry has evolved, so has Optimal, expanding the platform, advancing participant recruitment, and building Optimal Intelligence AI to accelerate insight to action.
Now, we’re at the edge of another major shift. With the launch of the Model Context Protocol (MCP), we’re entering a new realm, moving from traditional research workflows to AI-powered intelligence.
Research data is one of the most valuable assets in any organization, but until now, it has been scattered across studies and reports, time-consuming to search and synthesize, and different to search or reuse. MCP now changes that for research teams.
Model Context Protocol (MCP) enables you to connect your Optimal research directly to AI tools, like ChatGPT, Claude, or Cursor, to explore and analyze your data seamlessly. Insights can go beyond data downloads, dashboards, or static reports. Access your insights and explore further with natural conversation.
Get instant insights for questions like:
With MCP-connected tools, you can:
The evolution is clear.
We started by helping teams understand users through early UX research methods.
We helped formalize how research is conducted, analyzed, and shared.
And now, with MCP in Optimal, we’re helping teams move beyond analysis altogether toward conversational, AI-driven research intelligence.
Log in to Optimal, connect with your AI tools, and get the most value from your research or book a demo to start building your research repository with Optimal.
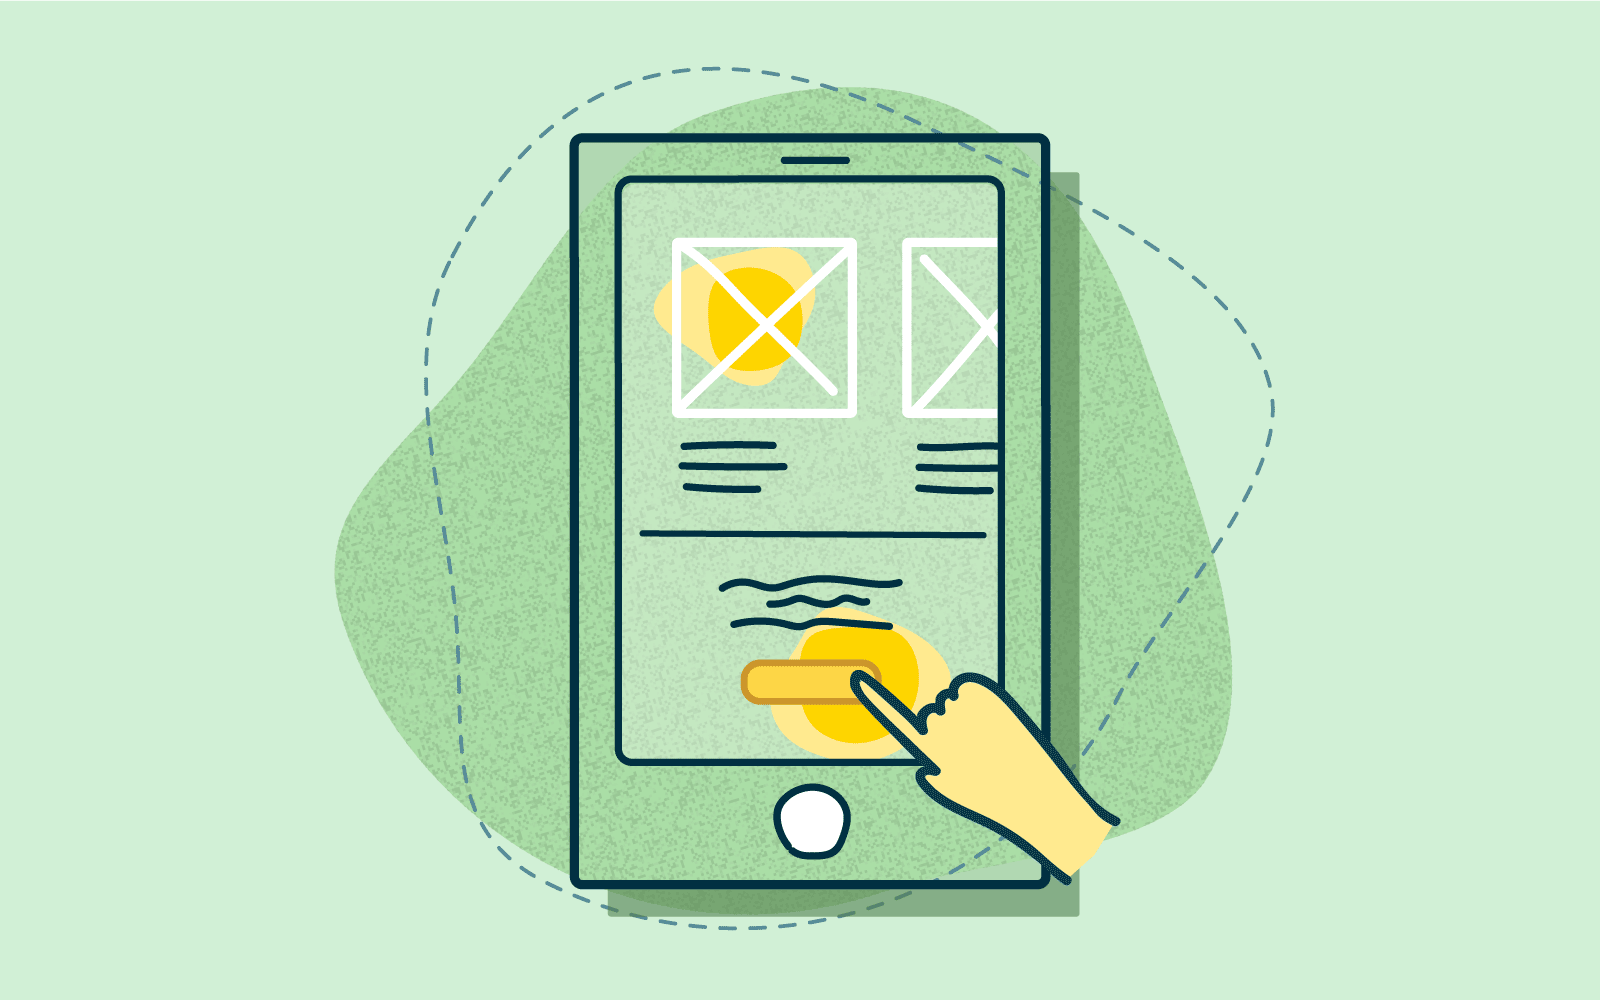
Mobile app testing with users before, during and beyond the design process is essential to ensuring product success. As UX designers we know how important usability is for interaction design, but testing early and often on mobile can sometimes be a challenge. This is where usability testing tools like Chalkmark (our first-click testing tool) can make a big difference.
First-click testing on mobile apps allows you to rapidly test ideas and ensure your design supports user goals before you invest time and money in further design work and development. It helps you determine whether you’re on the right track and whether your users are too — people are 2 to 3 times as likely to successfully complete their task if they got their first click right.
Read on for our top tips for mobile testing with Chalkmark shared through an example of a study we recently ran on Airbnb and TripAdvisor’s mobile apps.
There’s 2 ways that you might approach mobile app testing with Chalkmark: remotely or in person. Chalkmark is great for remote testing because it allows you to gain insights quickly as well as reach people anywhere in the world as the study is simply shared via a link. You might recruit participants via your social networks or email lists or you could use a recruitment service to target specific groups of people. The tool is also flexible enough to work just as well for moderated and in-person research studies. You might pop your study onto a mobile device and hit the streets for some guerrilla testing or you might incorporate it into a usability testing session that you’ve already got planned. There’s no right or wrong way to do it — it really depends on the needs of your project and the resources you have available.
For our Airbnb and TripAdvisor mobile app study example, we decided to test remotely and recruited 30 US based participants through the Optimal Workshop recruitment service.
Chalkmark works by presenting participants with a real-world scenario based task and asking them to complete it simply by clicking on a static image of a design. That image could be anything from a rough sketch of an idea, to a wireframe, to a screenshot of your existing product. Anything that you would like to gather your user’s first impressions on — if you can create an image of it, you can Chalkmark it.
To build your study, all you have to do is upload your testing images and come up with some tasks for your participants to complete. Think about the most common tasks a user would need to complete while using your app and base your mobile testing tasks around those. For our Airbnb and TripAdvisor study, we decided to use 3 tasks for each app and tested both mobile apps together in one study to save time. Task order was randomized to reduce bias and we used screenshots from the live apps for testing.
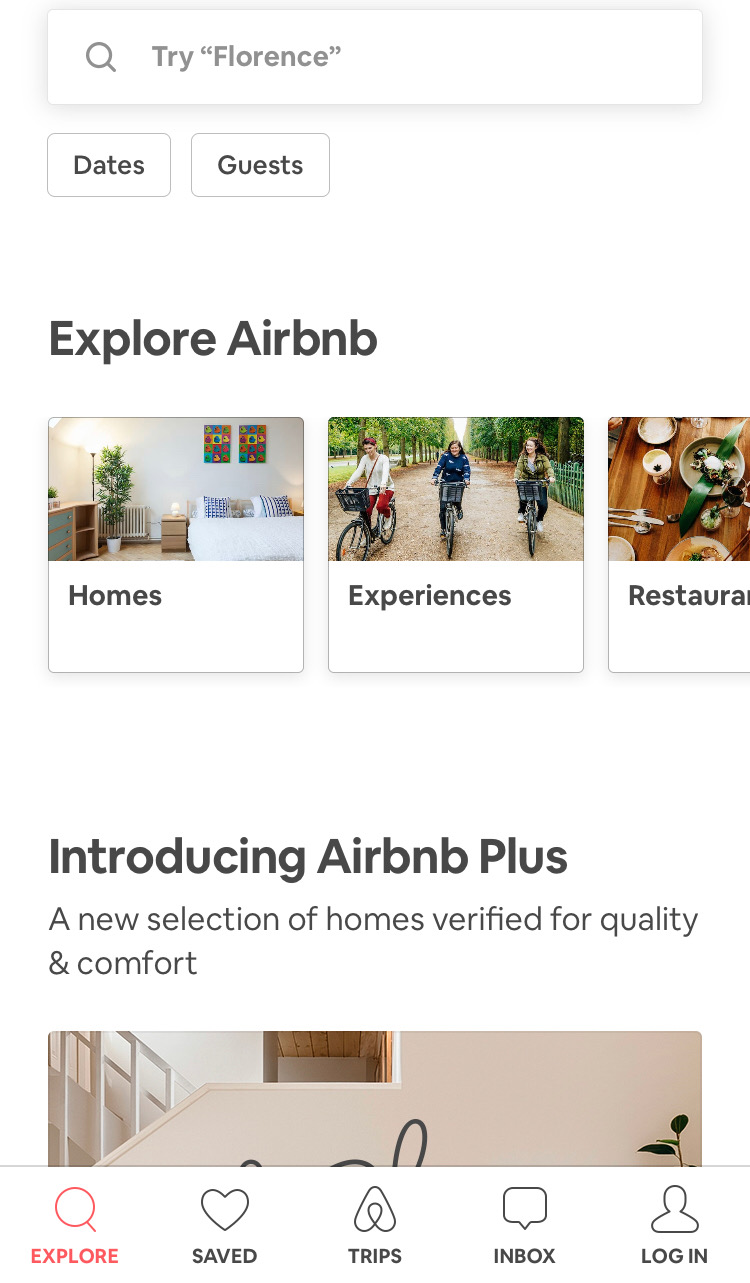
For Airbnb, we focused our mobile testing efforts on the three main areas of their service offering: Homes, Experiences and Restaurants. We wanted to see if people understood the images and labels used and also if there were any potential issues with the way Airbnb presents these three options as horizontally scrollable tiles where the third one is only partially shown in that initial glance.
For TripAdvisor, we were curious to see if the image-only icons on the sticky global navigation menu that appears when the page is scrolled made sense to users. We chose three of these icons to test: Holiday Rentals, Things To Do and Forums.

Our Chalkmark study had a total of 6 tasks — 3 for each app — and we tested both mobile apps together to save time.
Our tasks for this study were:
1. You’ll be spending the holidays with your family in Montreal this year and a friend has recommended you book yourself into an axe throwing workshop during your trip.
2. Where would you go to do this? (Airbnb)
3. You’ve heard that Airbnb has a premium range of places to stay that have been checked by their team to ensure they’re amazing. Where would you go to find out more? (Airbnb)
4. You’re staying with your parents in New York for the week and would like to surprise them by taking them out to dinner but you’re not sure where to take them. Where would you go to look for inspiration? (Airbnb)
5. You’re heading to New Zealand next month and have so many questions about what it’s like! You’d love to ask the online community of locals and other travellers about their experiences. Where would you go to do this? (TripAdvisor)
6. You’re planning a trip to France and would prefer to enjoy Paris from a privately owned apartment instead of a hotel. Where would you go to find out what your options are? (TripAdvisor)
7. You’re currently on a working holiday in Melbourne and you find yourself with an unexpected day off. You’re looking for ideas for things to do. Where would you go to find something like this? (TripAdvisor)
Task order was randomized to reduce bias and we used screenshots from the live apps for testing.All images used for testing were the size of a single phone screen because we wanted to see if they could find their way without needing to scroll. As with everything else, you don’t have to do it this way — you could make the image longer and test a larger section of your design or you could focus on a smaller section. As a testing tool, Chalkmark is flexible and scalable.
We also put a quickly mocked up frame around each image that loosely resembled a smart phone because without it, the image looked like part of it had been cropped out which could have been very distracting for participants! This frame also provided context that we were testing a mobile app.
Chalkmark makes it really easy to make sense of your research through clickmaps and some really handy task results data. These 2 powerful analysis features provide a well-rounded and easy to digest picture of where those valuable first clicks landed so that you can evolve your design quickly and confidently.
A clickmap is a visualization of where your participants clicked on your testing image during the study. It has different views showing heatmaps and actual click locations so you can see exactly where they fell. Clickmaps help you to understand if your participants were on the right track or, if they weren’t, where they went instead.The task results tab in Chalkmark shows how successful your participants were and how long it took them to complete the task. To utilize the task results functionality, all you have to do is set the correct clickable areas on the images you tested with — just click and drag and give each correct area a meaningful name that will then appear alongside the rest of the task results. You can do this during the build process or anytime after the study has been completed. This is very useful if you happen to forget something or are waiting on someone else to get back to you while you set up the test!
For our Airbnb and TripAdvisor study, we set the correct areas on the navigational elements (the tiles, the icons etc) and excluded search. While searching for something isn’t necessarily incorrect, we wanted to see if people could find their way by navigating. For Airbnb, we discovered that 83% of our participants were able to correctly identify where they would need to go to book themselves into an axe throwing workshop. With a median task completion time of 4.89 seconds, this task also had the quickest completion time in the entire study. These findings show that the label and image being used for the ‘Experiences’ section of the app appears to be working quite well.
We also found that 80% of participants were able to find where they’d need to go to access Airbnb Plus. Participants had two options and could go via the ‘Homes’ tile (33%) or through the ‘Introducing Airbnb Plus’ image (47%) further down. Of the remaining participants, 10% clicked on the ‘Introducing Airbnb Plus’ heading, however at the time of testing, this area was not clickable. It’s not a huge deal because these participants were on the right track and would have likely found the right spot to click fairly quickly anyway. It’s just something to consider around user expectations and perhaps making that heading clickable might be worth exploring further.
83% of our participants were able to figure out where to go to find a great restaurant on the Airbnb app which is awesome! An additional 7% would have searched for it which isn’t wrong, but remember, we were testing those navigational tiles. It’s interesting to note that most people selected the tiles — likely indicating they felt they were given enough information to complete the task without needing to search.
For our TripAdvisor tasks, we uncovered some very interesting and actionable insights. We found that 63% of participants were able to correctly identify the ‘Forums’ icon as the place to go for advice from other community members. While 63% is a good result, it does indicate some room for improvement and the possibility that the ‘Forums’ icon might not be reasonating with users as well as it could be. For the remaining participants, 10% clicked on ‘Where to?’ which prompts the user to search for specific locations while 7% clicked on the more general search option that would allow them to search all the content on the app.
63% of participants were able to correctly identify the ‘Holiday Rentals’ icon on the TripAdvisor app when looking for a privately owned apartment rather than a hotel to enjoy Paris from, while 20% of participants appear to have been tripped up by the ‘Hotel’ icon itself.
With 1 in 5 people in this study potentially not being able to distinguish between or determine the meaning behind each of the 2 icons, this is something that might merit further exploration. In another one of the TripAdvisor app’s tasks in this study, 43% of participants were unable to correctly identify the ‘Things To Do’ icon as a place to find inspiration for activities.Where to from here?
If this were your project, you might look at running a quick study to see what people think each of the 6 icons represent. You could slip it into some existing moderated research you had planned or you might run a quick image card sort to see what your users would expect each icon to relate to. Running a study testing all 6 at the same time would allow you to gain insights into how users perceive the icons quickly and efficiently.
Overall, both of these apps tested very well in this study and with a few minor tweaks and iterations that are part of any design process, they could be even better!
Now that you’ve seen an example of mobile testing in Chalkmark, why not try it out for yourself with your app? It’s fast and easy to run and we have lots of great resources to help you on your way including sample studies that allow you to interactively explore both the participant’s and the researcher’s perspective.
Further readingCreate and analyze a first-click test for freeView a first-click test as a participantView first-click test results as a researcherRead our first-click testing 101 guideRead more case studies and research stories to see first-click testing in action
Originally published on 29 March 2019
Please note: This tool is a work in progress and isn’t yet available to all Optimal Workshop customers. If you’d like to opt in to the beta, pop down to the bottom of this article to find out more.
The ability to collect robust and trustworthy qualitative analysis is a must for any team who conducts user research. But so often, the journey to getting those juicy insights is time-consuming and messy. With so many artefacts – usually spread across multiple platforms and mediums – trying to unearth the insights you set out to get can feel overwhelming.
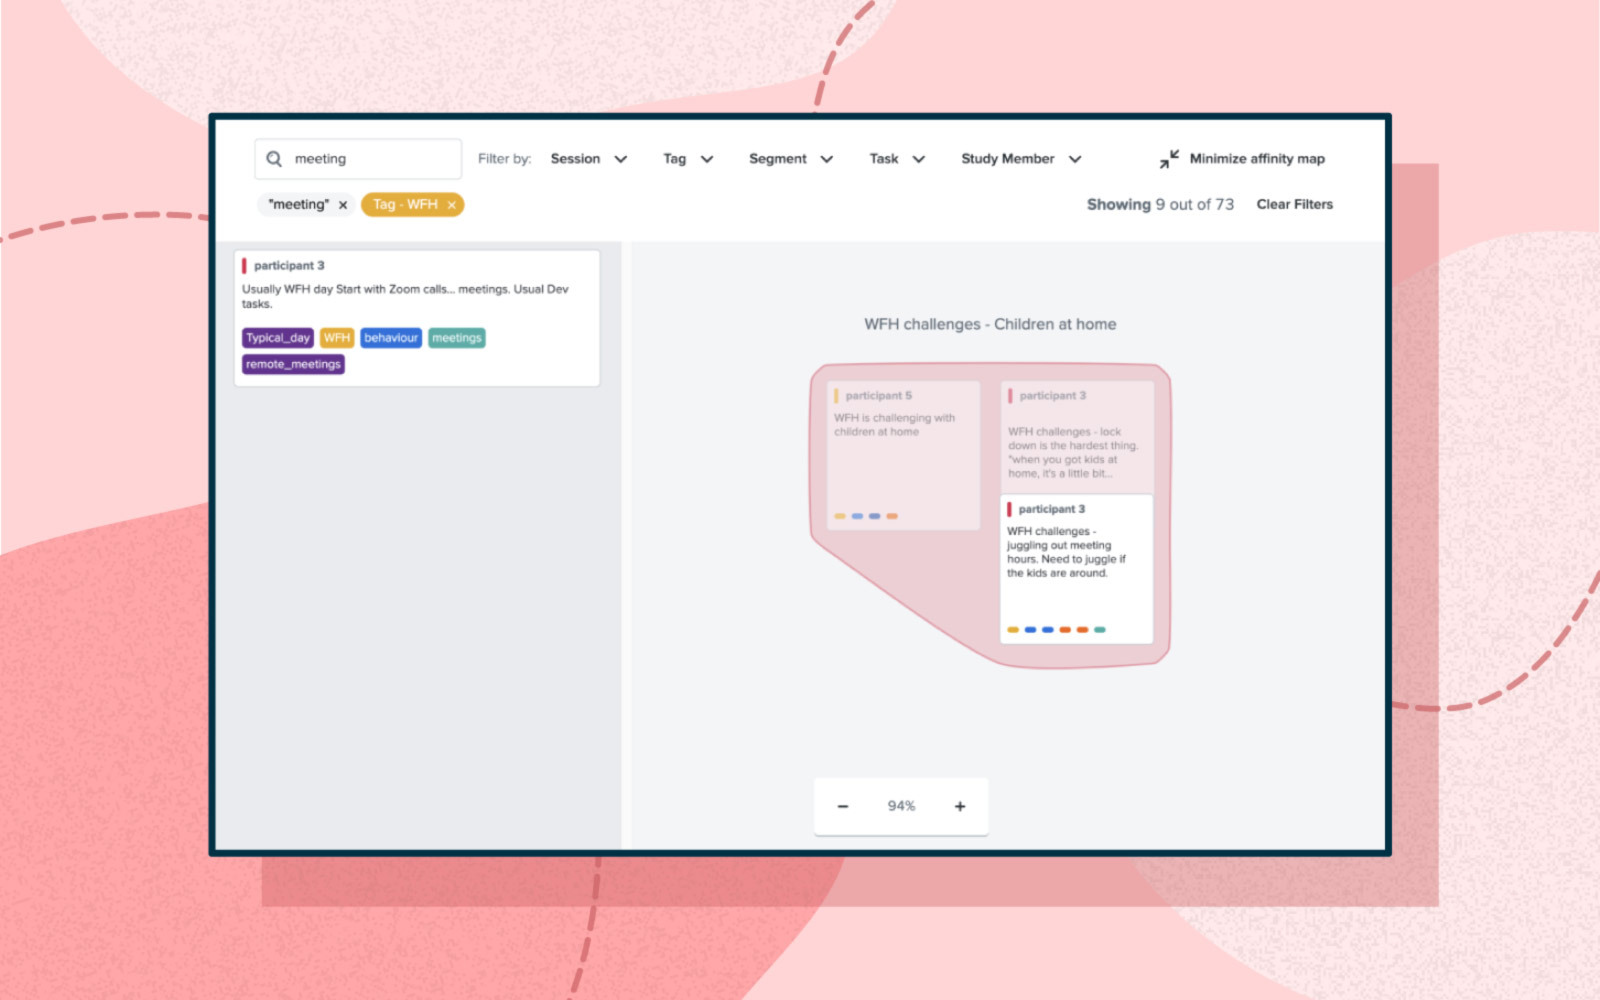
Since launching Reframer in 2019, we’ve had some great feedback from our users and the community. This feedback has led to the development of the beta version of Reframer v2 – in which we’ve expanded the note taking and tagging capabilities, as well as building a more powerful and flexible analysis functionality: affinity mapping.
Simply put, Reframer v2 is a workflow that houses your data and insights all in one place. Yes, that’s right! No more context switching between various platforms or tabs. It’s an end-to-end qualitative analysis workflow that allows you to capture, code, group and visualize your data.

We’ve put a lot of focus into making sure that the analysis side of things is easy to learn and understand, regardless of your experience level. It’s also more flexible and better suited to qualitative research with data sets both big and small.
The main difference is the analysis workflow. Reframer’s tag-based theme builder has been replaced with an affinity map-based workflow in v2 beta.
The rest of the workflow remains mostly the same, though there are a couple of key differences.
While the activities within the set up and capture phase remain the same, we’ve updated the user interface to better reflect the qualitative research workflow.
All set up related actions (study overview, tasks, tags, segments, and study members) now live together under one tab – ‘Setup’.
You’ll find your sessions and all the observation data you’ve collected in the ‘Sessions’ tab.

For now, we’ve disabled the ability to invite guest notetakers who don’t hold an Optimal Workshop license. That’s not to say this won’t be reintroduced at some stage in the future, though. And of course, your team members who do have a license will be able to collaborate, take notes and analyze data.
The biggest (and the best) difference between Reframer and v2 beta is the analysis workflow. In Reframer, themes are created by combining filters and tags. In Reframer v2 beta, themes are created by grouping observations in the affinity map.

Affinity mapping is a flexible and visual way to quickly group, organize and make sense of qualitative data. It’s a popular method amongst research practitioners of all experience levels, though it’s usually conducted in a standalone tool outside of where the raw data is captured, organized, tagged and stored.
Reframer v2 beta makes affinity mapping more powerful and user-friendly than ever – giving you the ability to search and filter your data, and have your observations, tags, and themes all connected and stored in one place.
It means that Reframer v2 is still very much a work in progress and isn’t yet available to all Optimal Workshop users. We’re continuing to develop new functionality that will complete the qualitative data analysis workflow and, if you’re part of the beta, you can expect to see new features and changes being rolled out in the coming months.
There may be a few bugs along the way, and we know the current name doesn’t exactly roll off the tongue so standby for a rebrand of the tool name once it’s ready for general consumption!
Want to help us make Reframer v2 beta really, really great? We’d love that. We here at Optimal Workshop rely on your thoughts, opinions and feedback to build and update our tools so they benefit those who matter most: you.
If you’d like to opt into the beta, sign up here.
And if you’d like to get down into the nitty gritty about the what, why and how of Reframer v2 beta, check out our Help Center articles here.

Want to do great user research? Maybe you already have tonnes of quantitative research done through testing, surveys and checking. Data galore! Now you really want to get under the skin of your users, understand the why behind their decisions. Getting human-centric with products can mean creating better performing, stronger and more intuitive products that provide an awesome user experience (UX). An in-depth understanding of your users and how they tick can mean the difference between designing products that just work and products that intuitively speak your users language, make them happy, engaged and keep them coming back.
This is where qualitative research comes into play. Understanding how your users tick becomes clearer through user interviews. Interviewing users will provide human insights that make all the difference, the nuance that pulls your product or interface out of the fray and into the light.
How do you interview confidently? Whether this is your first foray into the world of user interviewing or wanting to step up your game, there are a few common pitfalls along the way. We cover off 7 of the most common mistakes, and how to avoid them, helping you avoid these on your way to interview greatness!
There are several ways of doing qualitative user research. Here we will talk about in-person user interviews. Great user interviewing is a skill in itself. And relies on great prep, quality participants and excellent analysis of the results. But don’t be put off, all of this can be learned, and with the right environment and tools can be simple to implement. Want to find out more in detail about how to conduct an interview? Take a look here.
Even if you’re an old hand we’re not all gifted interviewing experts, it’s okay if you lack expertise. In fact, totally nailing interview technique is almost impossible thanks to a ton of different factors. It's your job to keep what you can under control, and record the interview well in the moment for later analysis. Keeping safe all those lovely human centric insights you unearth.
Here are seven practical user research interview mistakes you could be making, and how to fix them:
It can be intimidating doing any sort of user research. Particularly when you need to find participants. And a random selection, not just those down the hall in the next office (though sometimes they can be great). And getting a large enough pool of participants that make the data meaningful, and the insights impactful.
Not to worry, there are ways to find a giant pool of reliable interview participants. Either dive into existing users that you are familiar with, and they with you. Or get in touch with us to recruit a small or large sample of participants.
Interviews are two-way streets, so if you’re hoping to encourage anyone to be open and honest in an interview setting you’ll need to do your homework on the person you’re interviewing. This may not always be applicable if you’re looking for a truly random sample of people. Understanding a little more about your participants should help the conversation flow, and when you do go off-script, it is natural and curiosity driven.
Everything about your user interview environment affects the outcome of the interview. Your participants need to feel confident and comfortable. The space needs to remove as many distractions as possible. A comfortable workstation, laptop that works, and even the air conditioning at a good temperature can all play a part in providing a relaxed environment. So when it comes to the interview they are able to demonstrate and explain their behaviour or decisions on their own terms.
Of course, in this modern day, the availability of remote and virtual interviewing has changed the game slightly. Allowing your participants to be in their own environment can be beneficial. Be careful to take note of what you can see about their space. Is it crowded, dim, busy or noisy? If you don’t have full control over the environment be sure to note this in a factual way.
Good note-taking is a skill in its own right and it’s important to have someone skilled at it. Bringing a dedicated note-taker into the user interviews also frees you up to focus on your participant and your interviewing. Allowing the conversation to flow. Leaving the note-taker to focus on marking down all of the relevant points of interest.
Deciding to audio (and/or video) record the interview is a great option. When choosing this option, recording can be possibly the most important aspect of the interview setup process. Being able to focus on the interview without worrying about your recording equipment is key. Make sure that your recording equipment is high quality and in a central position to pick up everything you discuss - don’t trip at the first hurdle and be left with unusable data.
A dedicated note-taker can still be of value in the room, they can monitor the recording and note any environmental or contextual elements of the interview process. Taking the stress off of you for the recording set up, and any adjustments.
Another option is Reframer. It’s a great recording tool that can free you up to focus on your participant and the interview. Reframer will audio record your interview,auto time-stamp and provide a standardized format for recording all of your interviews. Post analysis becomes simple and quick. And even quicker to share the data and insights.
Lack of preparation can be a fatal error for any user research and user interviews are no different. Interviews are a qualitative research method, and your questions don’t need to be as strict as those in a quantitative questionnaire, for example. However, you will still need a standardised script to regulate your user interviews and make sure all of your participants are asked the same set of questions. Always leaving plenty of room to go off script to get under the skin of why your participant interacts with your product in a particular way!
Qualitative data is unstructured, which can make it hard to organize and analyze. Recording and including all of your interviews on one platform so you can analyze the insights and conclusions together makes it easier to review. Reframer can do all of this in one place allowing all of your organizational stakeholders access to the data.
Don’t miss anything in your interviews, you put in the time, the effort and the investment into doing them. Make sure that they are recorded, available and analyzed in one place. For the team to see, use and report against.
User interviews can be intimidating, to organise, to prep for and even finding your participants can be hard. But user interviews needn’t be too much of a headache. With the Optimal Workshop platform, we take the pain out of the process with participant selection, recording, analyzing and reporting.
If you want a single platform to record, analyze and store your data, take a look at Optimal Workshop and Reframer. And get interviewing!
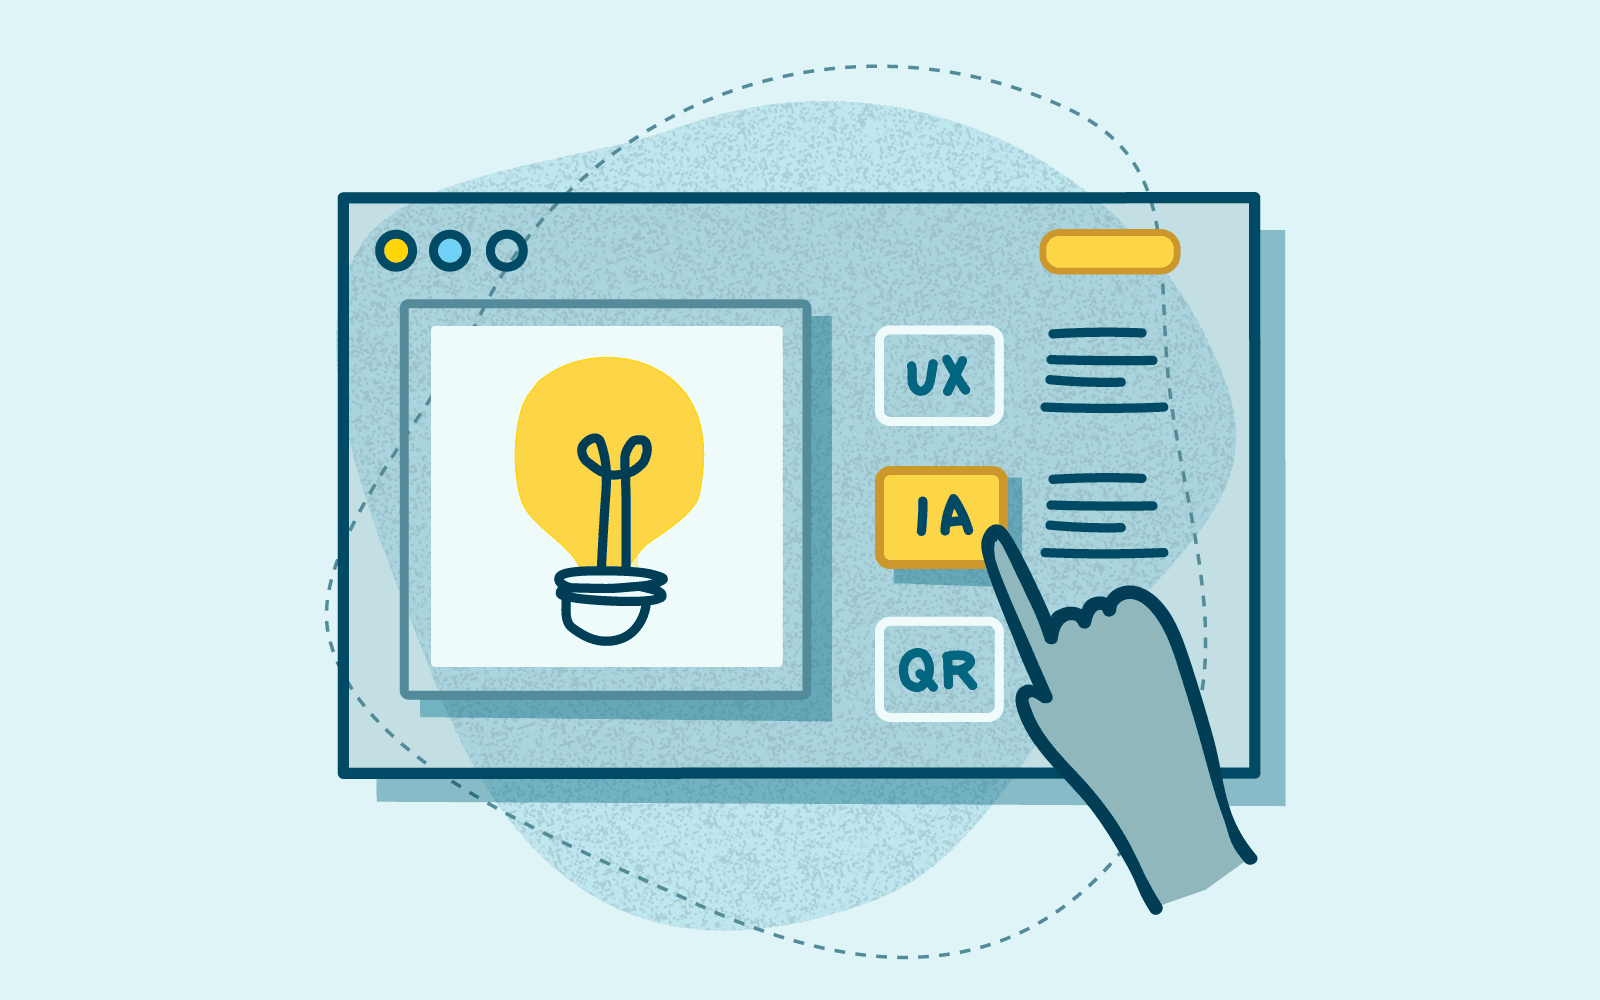
As an information architect, I’ve worked on loads of website redesigns. Interestingly, every single one of these projects has come about because the website has had navigation problems. But before you go ahead and change up your information architecture (IA), how do you figure out whether the new navigation is any better than the existing one? How do you know if it’s worth the hours of design to implement it?
In this article, I’ll walk you through how to benchmark a site navigation using tree testing.
When you start any project, you need to identify success metrics. How would the project sponsor (or your client if you’re in an agency) consider the project to be a success? What KPIs determine how the project is doing?
Put your stake in the ground, draw a line in the sand — or whatever metaphor you wish to use. This is how you objectively determine how far you’ve gone from where you started. At the same time, benchmarking is the perfect exercise to figure out the areas that need improvement. To do this, you’ll need to lay down the groundwork.
If you’re benchmarking your IA as part of a web redesign project, great! Hopefully, that means you’ve already gone through the exercise of determining who your users are and what it is that your users would be doing on the site. If not, it’s time to find out. User research is a crucial part of benchmarking. If you don’t know who your users are and why they’re on your site, how can you improve it?
Of course, everyone has a different approach to benchmarking information architecture. Different navigation problems merit different solutions. This is one that I’ve talked myself into for a global navigation project and it’s worked out for me. If you have a different approach, please share! I’m always open to new processes.
Without further preamble, here’s the quick rundown of my approach to assessing and benchmarking a site navigation:
If it’s a new project, who is your target audience? Set up some kind of intercept or survey to find out who your users are. Find out what kind of people are coming to your site. Are they shopping for new cars or used cars? Are they patients or healthcare providers? If patients, then what kind of patients? Chronic care, acute care? If the project timeline doesn’t allow for this, discuss this with your project stakeholders. Ideally, they should have some idea of who their target audience is and you should at least be able to create proto user segments to direct your discovery.
If you have more than one user group, it’s best to identify the primary user group to focus efforts. If you have to design for everyone, you end up getting nowhere, satisfying no one. And guess what? This is not a novel idea.
“When you design for everyone, you design for no one.” — @aarron http://t.co/JIJ2c82d Ethan Marcotte (@beep) May 24, 2012
Your project stakeholder won’t like to hear this, but I would start with one user group and then iterate with additional user groups. Focus your efforts with one user group and do a good job. Then rinse and repeat with the remaining user groups. Your job is not done.
Interview or survey a couple of people who use your website and find out what they are doing on your site. What are they trying to do? Are they trying to find out information about services you provide? Are they trying to purchase things from your online store? How did they get there? Why did they choose your site over another website?
From your user interviews, could you identify 8-10 priority user tasks that you could use? For this, we’re trying to figure out what tasks to use in a navigation test. What are the main reasons why users would be on your site? How would the navigation best serve them? If your navigation says nothing about your users’ tasks, then you have your work cut out for you.
How would you benchmark without some metrics? There are a couple kinds of metrics that we could collect: quantitative and qualitative. For quantitative, I’m assuming that you have some kind of analytics running on your site as well as event tracking. Track which navigation links are getting the most interaction. Be sure to use event tracking on both primary, utility, and footer links. Name them accordingly. Try and determine which links get the most interaction, on which pages, and follow where the users tend to end up.
Of course, with quantitative data, you don’t have a really good understanding of the reasons behind user behavior. You can make assumptions, but those won’t get you very far. To get this kind of knowledge, you’ll need some qualitative data in the form of tree testing, also known as navigation testing.
I’ve only used Optimal Workshop’s First-click testing tool for tree testing, so I can’t speak to the process with other services (I imagine that it would be similar). Here are the general steps below — you can find a more detailed process in this Tree Testing 101 guide.
For my recent project, I focused benchmarking on the primary navigation. Don’t combine different types of navigation testing in one — you can do that in a usability test. Here, we’ll just be testing the primary navigation. Search and utility links are secondary, so save those for another time.
Take the user tasks you’ve identified earlier and enter them into a tree test. From this point on, go with best practices when setting up your tree test.
For more tips on setting up your tree test, check out this Knowledge Base article.
Once you’ve finished testing, it’s time to look for patterns. Set up the baseline metrics using success rate, time spent, patterns in the pietrees — this is the fun stuff!
Focus on the tasks that did not fare as well, particularly the ones that had an overall score of 7 or below. This is an easy indicator that you should pay more attention to the labeling or even the choice you indicated as the correct answer.
From here, you can set up the same tree test using a competitor’s site tree and the same user tasks. This is helpful to test whether a competitor’s navigation structure is an improvement over your existing one. It also helps with discussions where a stakeholder is particularly married to a certain navigation scheme and you’re asked to answer: which one is better? Having the results from this test helps you answer the question objectively.
When you have a proposed sitemap, test it again with the same tasks and you can use these to figure out whether the changes you made changed anything. You can also conduct this test over time.
You could daisy-chain one tree test after another to test an existing nav and a competitor’s. Just keep in mind that you may need to limit the number of user tasks per tree test so that you don’t overwhelm the participant.
Qualitative user research is about exploration. Exploration is about the journey, not only the destination (or outcome). Gaining information and insights about your users through interviews, usability testing, contextual, observations and diary entries. Using these qualitative research methods to not only answer your direct queries, but to uncover and unravel your users ‘why’.
It can be important to use qualitative research to really dig deep, get to know your users and get inside their heads, and their reasons. Creating intuitive and engaging products that deliver the best user experience.
The term ‘qualitative’ refers to things that cannot be measured numerically and qualitative user research is no exception. Qualitative research is primarily an exploratory research method that is typically done early in the design process and is useful for uncovering insights into people’s thoughts, opinions, and motivations. It allows us to gain a deeper understanding of problems and provides answers to questions we didn’t know we needed to ask.
Qualitative research could be considered the ‘why’. Where quantitative user research uncovers the how or the what users want. Qualitative user research will uncover why they make decisions (and possibly much more).
When undertaking user research it is great to do a mix of quantitative and qualitative research. Which will round out the numbers with human driven insights.
Quantitative user research methods, such as card sorting or tree testing, will answer the ‘what’ your users want, and provide data to support this. These insights are number driven and are based on testing direct interaction with your product. This is super valuable to report to stakeholders. Hard data is difficult to argue what changes need to be made to how your information architecture (IA) is ordered, sorted or designed. To find out more about the quantitative research options, take a read.
Qualitative user research, on the other hand, may uncover a deeper understanding of ‘why’ your users want the IA ordered, sorted or designed a certain way. The devil is in the detail afterall and great user insights are discoverable.
Priorities for your qualitative research needs to be less about the numbers, and more on discovering your users ‘why’. Observing, listening, questioning and looking at reasons for users decisions will provide valuable insights for product design and ultimately improve user experience.
Usability Testing - this research method is used to evaluate how easy and intuitive a product is to use. Observing, noting and watching the participant complete tasks without interference or questions can uncover a lot of insights that data alone can’t give. This method can be done in a couple of ways, moderated or unmoderated. While it can be quicker to do unmoderated and easier to arrange, the deep insights will come out of moderated testing.
Observational - with this qualitative research method your insights will be uncovered from observing and noting what the participant is doing, paying particular attention to their non-verbal communication. Where do they demonstrate frustration, or turn away from the task, or change their approach? Factual note taking, meaning there shouldn’t be any opinions attached to what is being observed, is important to keep the insights unbiased.
Contextual - paying attention to the context in which the interview or testing is done is important. Is it hot, loud, cold or is the screen of their laptop covered in post-its that make it difficult to see? Or do they struggle with navigating using the laptop tracker? All of this noted, in a factual manner, without personal inferring or added opinion based observations can give a window into why the participant struggled or was frustrated at any point.
These research methods can be done as purely observational research (you don’t interview or converse with your participant) and noting how they interact (more interested in the process than the outcome of their product interaction). Or, these qualitative research methods can be coupled with an
Interview - a series of questions asked around a particular task or product. Careful note taking around what the participant says as well as noting any observations. This method should allow a conversation to flow. Whilst the interviewer should be prepared with a list of questions around their topic, remain flexible enough to dig deeper where there might be details or insights of interest. An interviewer that is comfortable in getting to know their participants unpicks reservations and allows a flow of conversation, and generates amazing insights.
With an interview it can be of use to have a second person in the room to act as the note taker. This can free up the interviewer to engage with the participant and unpick the insights.
Using a great note taking side kick, like our Reframer, can take the pain out of recording all these juicy and deep insights. Time-stamping, audio or video recordings and notes all stored in one place. Easily accessed by the team, reviewed, reports generated and stored for later.
You’re creating a new app to support your gym and it’s website. You’re looking to generate personal training bookings, allow members to book classes or have updates and personalise communication for your members. But before investing in final development it needs to be tested. How do your users interact with it? Why would they want to? Does it behave in a way that improves the user experience? Or does it simply not deliver? But why?
First off, using quantitative research like Chalkmark would show how the interface is working. Where are users clicking, where do they go after that. Is it simple to use? You now have direct data that supports your questions, or possibly suggests a change of design to support quicker task completion, or further engagement.
While all of this is great data for the design, does it dig deep enough to really get an understanding of why your users are frustrated? Do they find what they need quickly? Or get completely lost? Finding out these insights and improving on them can make the most of your users’ experience.
When quantitative research is coupled with robust qualitative research that prioritizes an in-depth understanding of what your users need, ultimately the app can make the most of your users’ experience.
Using moderated usability testing for your gym app, observations can be made about how the participant interacts with the interface. Where do they struggle, get lost, or where do they complete a task quickly and simply. This type of research enhances the quantitative data and gives insight into where and why the app is or isn't performing.
Then interviewing participants about why they make decisions on the app, how they use it and why they would use it. These focussed questions, with some free flow conversation will round out your research. Giving valuable insights that can be reviewed, analyzed and reported to the product team and key stakeholders. Focussing the outcome, and designing a product that delivers on not just what users need, but in-depth understand of why.
Quantitative and qualitative user research do work hand in hand, each offering a side to the same coin. Hard number driven data with quantitative user research will deliver the what needs to be addressed. With focussed quantitative research it is possible to really get a handle on why your users interact with your product in a certain way, and how.
The Optimal Workshop platform has all the tools, research methods and even the note taking tools you need to get started with your user research, now, not next week! See you soon.

We take a look at three qualitative research methods which can be started quickly with a bit of planning, and minimal participants while delivering great data insights.
The term ‘qualitative’ refers to things that cannot be measured numerically and qualitative research is no exception. Qualitative research is primarily an exploratory research method that is typically done early in the design process. It's useful for uncovering insights into people’s thoughts, opinions, and motivations. It allows us to gain a deeper understanding of problems and provides answers to questions we didn’t know we needed to ask.
Qualitative research can be viewed as the 'why' versus quantitative user research which uncovers the 'how' or the 'what' users want. Qualitative user research helps us uncover why people make decisions (and potentially much more).
Here's three qualitative research exercises you can start today:
Usability testing is a research method designed to evaluate how easy something is to use by testing it with representative users. In most cases, this ‘something’ is a prototype of a website or interface. Or it could just as easily be an existing website or product that requires more understanding of how it is currently used to identify faults or issues.
These tests typically involve observing a participant as they work through a series of tasks involving the product being tested. It’s a good idea to bring a notetaker along, so you can focus on asking questions. After you’ve conducted several usability tests, you can analyze your observations to identify the most common issues.
This can be a very practical start to the user research process. Observing, questioning and noting how a user interacts with your product in a very real environment can offer up some fantastic insights.
Usability testing is done in a real world environment which means you need your participant to complete tasks on a laptop or mobile phone. Ideally this is in a controlled environment, an office or space that can be managed. Usability testing relies on the facilitator being present. So, to start you only need five participants which helps as it isn't too many people to find and set up.
What to note: Usability testing is a great way to get an understanding of how exactly the participant interacts with the product. Note how they complete tasks, where their frustrations may be. Also look beyond what they are saying and observing what they are doing. This is invaluable to get the full picture of how they feel and analyzing the user experience.
Contextual inquiry is the observation of behaviours and reactions when users undertake specific tasks. By observing and paying attention to unspoken communication, you can uncover insights into behaviour and even expectations.
Giving the participant a set of tasks and observing how they complete these can be quite enlightening. Often what we do can be quite different to what we say we are doing.
By noting all of this during the testing session, and keeping our notes factual, they can provide context for why the participant may have changed their decision in a task or even abandoned it entirely. Ensuring that you don’t try and infer why they are feeling a certain way, and how that may influence their decisions is important to gaining insights.
Like usability testing this method only needs a minimal one-on-one environment to get started. A facilitator sets the test and observes the participant interacting with the product. You can start with as few as five participants, which means getting started with qualitative testing can be very quick to implement.
What to note: How they move or act while they complete tasks. Do they cross their arms, scratch their head or even sigh? Little things like trouble using the keyboard, can be implicit in how well they interpret the website.
User interviews are one-on-one facilitated conversations that are used to gain in-depth understanding of behaviours, opinions, and attitudes towards a product.
Building a relationship with the participant can be valuable, allowing the conversation to flow, and remove barriers. Interviews are an excellent opportunity to ask questions as well as dig deeper into the detail. They allow for follow up if further clarification be needed. Interviews are usually semi-structured with a list of open questions that are flexible enough to allow the interviewer to cover the required topics but also go wherever the conversation leads.
Interviews are also quite flexible because they don’t necessarily have to be conducted face to face. If time and resources are tight, they work just as well over the phone or via skype. Sessions can be recorded through note taking audio or video recording.
If you want to find out more about how to do a phone interview, have a read here.
There can be a flow over of observational insights. This can be as simple as noting throughout the session, how they react to certain set tasks. Are there moments that they are frustrated? Do they turn back and look for another way? Or do they seem irritated by the hardware, the laptop, mouse or even the reflection on the screen? All valuable (unspoken) information on how and why the participant makes decisions.
As with our three qualitative research methods you need a minimal number of participants to really get started with user interviews. They rely on a facilitator that does one-on-one interviews with a set of predetermined questions. You can start with as few as five participants, and depending on the research they can be from inside or outside your company. But they should be as relaxed, and natural as possible, to allow for real responses and observations.
What to note: User interviews are far more conversational than the previous two methods. You should have a script to work from, which will intend to uncover why your participant will want to work with your product a certain way. However, the interview allows some flexibility, with the facilitator able to dig deeper if needed, or change tack. Note the flow of conversation, and the various responses, as well as observed behaviours in a factual way.
After completing your session it is just as important to review it. Spend the time while it’s still fresh in your mind filling in any gaps in information by reviewing the audio and/or video. Great note taking is vital and using a digital note taking software (like our very own Reframer) can make the whole process much simpler and easier, to record, review, analyze and share your data. If you want more tips on how to take great notes in qualitative user research have a look at this.
So, you’ve gone ahead and researched your product and you’ve got some amazing insights and data. What now? You need to pull it all together in a cohesive manner that breaks down what you’ve discovered and what it means. If you use our digital note taking software, Reframer, this can be fairly straight forward and streamlined. Having all of your notes, audio and video recordings, timestamping and observations in one place will allow the data to be generated and reviewed (and shared) swiftly. Pull together a report that can be shared among key shareholders and product managers. Present it in a way that allows your insights to clearly show where changes are needed, or improvements to the user experience can be made. It’s hard to argue with well researched data!
If you always thought that qualitative research was too hard, or took too long, think again. Take a look at the Optimal Workshop platform and we can help you through the whole process, taking the pain out, and putting the insights in.
Ready to get started finding out how your users really interact with your product? Get started now, and lots of our products mean you can start today!
