Subscribe to OW blog for an instantly better inbox
Oops! Something went wrong while submitting the form.
Articles and Podcasts on Customer Service, AI and Automation, Product, and more
.webp)
Nearly 18 years ago, Optimal helped define what UX research could be, pioneering practices and tools that would become industry standard and change how teams worldwide better understand their users. As the industry has evolved, so has Optimal, expanding the platform, advancing participant recruitment, and building Optimal Intelligence AI to accelerate insight to action.
Now, we’re at the edge of another major shift. With the launch of the Model Context Protocol (MCP), we’re entering a new realm, moving from traditional research workflows to AI-powered intelligence.
Research data is one of the most valuable assets in any organization, but until now, it has been scattered across studies and reports, time-consuming to search and synthesize, and different to search or reuse. MCP now changes that for research teams.
Model Context Protocol (MCP) enables you to connect your Optimal research directly to AI tools, like ChatGPT, Claude, or Cursor, to explore and analyze your data seamlessly. Insights can go beyond data downloads, dashboards, or static reports. Access your insights and explore further with natural conversation.
Get instant insights for questions like:
With MCP-connected tools, you can:
The evolution is clear.
We started by helping teams understand users through early UX research methods.
We helped formalize how research is conducted, analyzed, and shared.
And now, with MCP in Optimal, we’re helping teams move beyond analysis altogether toward conversational, AI-driven research intelligence.
Log in to Optimal, connect with your AI tools, and get the most value from your research or book a demo to start building your research repository with Optimal.

What is information architecture (IA) without its complementary elements? On this blog we’ve already discussed the information architecture elements of taxonomy and ontology, and now it’s time to take a look at choreography. While taxonomy refers to how information is grouped, classified and labeled and ontology refers to the meaning behind our words, choreography describes the rules for how all those parts should interact.
Choreography is essentially the nuts and bolts that bring organization, structure and meaning together to form one well-oiled machine that supports, enables and delights users on their path to task completion within a specific context.An often overlooked element of information architecture, nailing your choreography is essential to the delivery of a seamless user experience because it is present in everything your users will do on your website.
Coming back to our house analogy from my taxonomy blog, choreography would be present throughout the entire house determining how everything works together. It’s in the positioning of the door handles and hinges to enable easy access and use of rooms and so you don’t swing an open door into a shower screen or into the knees of a toilet user (who should have locked the door anyway). Choreography appears in open plan living environments seamlessly flowing from one space to the next. The way that the laundry is usually a room that includes an external door allowing an easy workflow from storing the dirty clothes, to washing them to hanging them outside on the line to dry. These are all examples of choreography.
In the context of a website, choreography is present in a number of different website elements. These might include: the rules for how a menu might respond or behave under specific circumstances, the way the user interface adapts to suit different devices, the hierarchical relationship between content and much more.
To help you understand how choreography might appear in a website IA context, I’ve scoured the internet and have found 3 interesting examples I’d like to share with you.
Mental Floss is an online publication designed for curious minds — sounds awesome! But the thing I find most interesting is the choreography that is present in the surfacing behavior of the top navigation menu. There are two different ways to access its content: you can either click on the big orange menu button in the top right hand corner and you’ll get everything in one hit — including the footer links (see two images below) — or you can scroll down or up the page and it will automatically drop down and become sticky giving you just the level 1 IA headings and that sticky orange menu button (see third image below).

Mental Floss as it appears when I first open the home page.

When I click on the big orange button

Now look what happens when I scroll a bit.... Ta da!
If you go with the scrolling option, you’re not going to miss out because Mental Floss appears to have been designed to be explored — might have something to do with that curiosity thing! All the links that live under the big menu button are distributed throughout the long scrolling page, so when you’re exploring the content, you also get everything! If you get really stuck, that sticky orange menu button is always there to help. If I scroll I get one thing and if I click I get something else, but no matter how I choose to consume the content I get access to everything without having to think about it. This website’s choreography supports both exploratory and direct navigation styles and brings all the parts together.
Part blog, part catalogue, part how-to hub, the Inspiration page on IKEA’s US website is a fascinating IA example because it exists outside the patterns used on the rest of the website. It’s like an IA within an IA. While the rest of the website has a wide rigid structure typical of large IAs, the Inspiration page (also titled ‘IKEA Ideas’) is more organic and is organized by content tags and is navigated by filtering (see below).


The tag cloud-like thing displays the content tags in alphabetical order. Each piece can be assigned up to four tags and users can filter by clicking or just peruse the whole lot by scrolling. Upon clicking a content tag, the piece selection below is automatically updated to only include pieces with the selected tag.Choreography on this part of IKEA’s US website is present in the relationship and behavior of the content tags and how that affects the information on the page.
Do nothing for 2 minutes has a completely flat IA and its choreography is present in the way it responds to user behavior and the way it presents visual and audio content. The website opens to a single page (see below image) showing an image of a beautiful sunset at the beach accompanied by the soothing sound of waves gently crashing and a group of seagulls fighting over a pickle someone tossed them from a McDonald’s cheeseburger (maybe that was me). It gives me a very clear instruction to “do nothing for 2 minutes” and presents a timer that immediately starts counting down.

In the centre of the screen in that sunlight created highlight are the the words “Just relax and listen to the waves. Don’t touch your mouse or keyboard.” It’s a bit hard to read and I didn’t instantly notice it but when I don’t follow its guidance, the timer resets and tells me to “try again”(see below image).

When I comply with its instructions, the clock ticks down and when there are just 40 seconds to go something magical happens — the wave sounds stop. It’s not jarring or surprising, in fact it actually felt like I dropped to a deeper state of relaxation. Like an experienced lead dance partner, this website’s choreography pushes and pulls the follower where it wants them to go. The rule here is: if I touch my mouse or keyboard, the clock resets, and if I follow the instructions, I get to access an additional layer of relaxation when the sound drops off. It forces me to take 2 whole minutes of out my day in a strict but supportive way.
When I reach the end of the 2 minutes, I’m congratulated and shown an advertisement for a book to help me further explore this technique. I usually hate seeing things like that but I don’t mind in this case because it doesn’t come across as pushy and it’s already given me something.
When you break it down, choreography is about behaviors and relationships between all the pieces of the IA. It’s about which parts go together, what they do and how that fits in with everything else. Think content pairings in a card sort and the hierarchical position of content within the IA’s tree structure — why do those cards go together and why does label Y appear directly before label X? These choices are deliberate; it’s not just a case of “Oh let’s just put them wherever,” or “I’m going to whack a certain label at the very top because my boss told me because that’s where he thinks it should go.” Choreography exists throughout your entire IA and like everything else, all refinements must be determined by user research.
When running a card sort, pay close attention to:
Cards that are paired — or not — as well as their hierarchical placement can not only provide insight into your users’ taxonomical expectations but can also help you identify relationships (or lack thereof) between content and elements. Say you were running a card sort on an intranet and two cards labeled ‘Annual Leave’ and ‘Public Holidays’ were consistently being grouped together under ‘Human Resources’. What’s their expected relationship and interaction beyond the subject matter connection? Does one appear before the other? Is one linked to the other one’s page? Or are they together on one page and if so how do they interact? (if at all). For moderated card sorts, listen closely to the conversation for insight into this and be sure to ask your participants about anything you’re not sure of.
If your IA is a bit further along in its development or you’d like to evaluate an existing IA, tree testing can help you understand the choreography that will best support your users.
Keep an eye on:
The pathways followed by participants in a tree test will help you determine the right sequence of interactions required by a user to reach their goal — the ultimate step by step flow to task completion. What order do the labels need to be in? And what lives underneath them? And again, in what order?Think of it like a path through the woods to a lake. Your IA’s choreography should enable your users to be seamlessly guided along a smooth pathway made of big stone steps. They shouldn’t be running into trees or bushwhacking to create their own pathways.
When looking at a tree test, consider how many of your participants did not follow the pathway/s you defined as correct. Where did they go instead? What does the right path look like to your users? Also look at where the all important first click landed. If users start out on the correct first click, they are almost 3 times as likely to reach their goal. If your participants started out on a different first click, you’ll need to explore why that is. It could indicate ambiguity in the labels, it could also be a sign of an expectations mismatch, a hierarchical issue or it could be something else entirely! The tree test will help you identify where the issues are, but you’ll need to go and have a conversation with your users to understand why it’s happening.
Unless more than say 80% of your participants achieved direct success in reaching their goal (meaning they never strayed from the big stone path that you defined) you’ll need to check these things anyway to resolve findability and usability issues. Choreography related insights are an extra thing you can pull from what you’re already doing. And of course always remember that any choreography related data has to be considered in conjunction with whether or not the labels are even correct. Choreography is just one piece of the puzzle; it sets the rules for how all the parts interact and isn’t going to be much help if the parts aren’t even right in the first place!
Choreography in information architecture might be one of the most overlooked elements but it’s not hard to give it the time and consideration it deserves and your users will thank you for it!
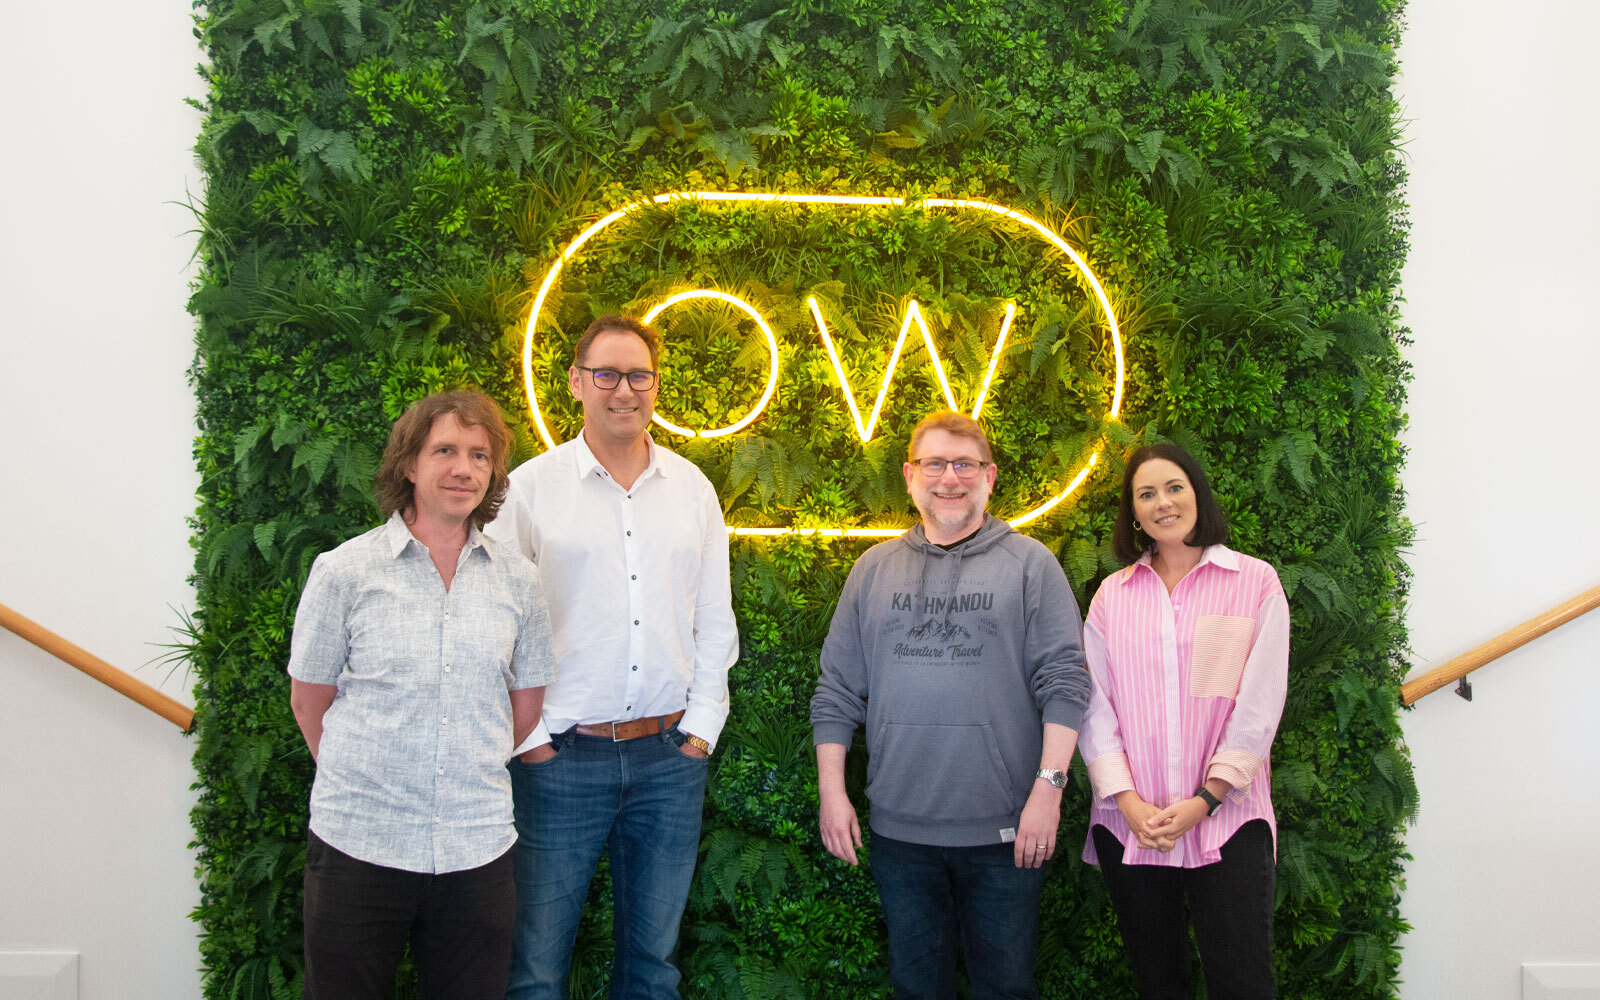
From left: Andrew Mayfield(CEO), Ben O'Grady(CFO), Seth Strumph(CTO), Meiken Bassant(COO)
FEB 8TH, 2022, WELLINGTON NZ: Optimal Workshop, a world leader in information architecture (IA) and digital user experience software, today announced a NZ$10 million investment by New Zealand private equity firm, Pioneer Capital.
It’s the first investment for Optimal Workshop, a New Zealand company with a deep-rooted history of challenging the status quo within the global user research industry. It pioneered some of the most widely used tools used in the growing field of information architecture (IA), including its card sorting and tree testing tools, used in over a hundred countries by some of the world’s best known brands including Uber, IBM and General Electric.
“We are obsessed with providing better digital experiences for all,'' says Optimal Workshop CEO, Andrew Mayfield. “In a world of complexity, we’re helping remove complications, needless confusion, and frustration through a quality product the world actually needs. This investment is a really important step in our journey to democratise information architecture and go faster and further.”
To date, Optimal Workshop has successfully grown organically over the past 14 years, while maintaining profitability.
In addition to its investment, Pioneer Capital has acquired a majority shareholding from Optimal Workshop’s founding shareholders, including a presence on the board.
Shayne Shepherd, Investment Director at Pioneer Capital, says the investment will support Optimal Workshop’s goal of improving the digital world around us, so more people have better experiences online.
“So much of the internet today has Optimal Workshop’s fingerprints on it, and demand in the user experience world is more pressing than it’s ever been. This investment gives Optimal Workshop additional resources to build and innovate, while still delivering exceptional services every day for its customers,” said Shepherd. “We are very excited to have the opportunity to partner with Andrew and the team for this next phase of growth.”
To support its product development and international growth aspirations, Optimal Workshop is looking to increase staff numbers by 50% in 2022.
‘For me, it’s always been about creating a work environment we all want to be in, ' says Mayfield. Where curiosity is celebrated, boldness and accountability encouraged and things like office dogs, obsessive recycling, and spontaneous lunch trains are just part of who we are. I’m thankful to the smart, savvy team at Optimal Workshop for helping me build a company worth believing in and can’t wait to see how far we can go, now we have Pioneer Capital on board.”
Kirsty Traill, who has been appointed Optimal Workshop chairperson, has wide-ranging leadership experience in some of the world’s top technology brands, and works with a number of Venture Capital and Private Equity firms advising their portfolio companies, as well as holding several Board positions.
“I am delighted to be joining the Board of Optimal Workshop as Chair, and have been impressed by Optimal Workshop’s great growth trajectory, strong leadership team, and exceptional customer focus. With this investment from Pioneer Capital, I truly believe Optimal Workshop is poised to really transform the way the world navigates online, and am honoured to be a part of the journey’s next phase,” said Traill.
Find out more about the story behind Optimal Workshop's investment in our blog

It’s going to be a big year for Optimal Workshop, with the recent announcement of a NZ$10m investment by New Zealand private equity firm, Pioneer Capital. We caught up with Andrew Mayfield, Optimal Workshop’s CEO, to find out the story behind the investment, why now, and what it means for the future.
The Tech start-up route isn’t for everyone but you’ve been part of Optimal Workshop’s success story from early on when it was ‘just 4 people in a windowless room’! What appealed to you back then?
“I worked on the initial prototype for Optimal Workshop with our founder, Sam Ng, in 2007 and eventually joined the team myself to take over from Sam two years later. When I was handed the reins the brief was simple: create ‘kick-ass tools that make life easier.
With this focus on tools to make life easier, life online especially, we settled on a suite focussed on user experience research. It’s turned out to be a field that’s grown an average of 40% year on year so there’s no reason to leave that field. In fact, I’d say Optimal Workshop has been a strong part of enabling the UX field, and user research especially, to grow as it has.”
So, that early focus on user experience was a good call, ahead of the curve even?
“It was timely I guess. People were just starting to appreciate user experience as a key differentiator. I’ve always thought of it as a necessary shift in the way people think about design. That you’d consider your users and you might follow specific methodologies so you can do that consistently and inclusively. Ideally, much of what we call user experience would eventually be considered a natural part of any good design process. It’s just good practice as a designer to consider the real, diverse, and evolving needs and context of the people who actually use what you make.”
When you put it that way it feels pretty compelling, even common sense. Fast forward 14 years, what’s the attitude towards UX now?
“What’s interesting now is there are so many people practicing user experience. When we started there was no UX-specific education, no university courses. Everybody in the field had come from some other field and they were all bringing their influences from somewhere else and I found that very interesting.
Every person I spoke to provided a different lens. It seemed to me that everyone had entered the field, even if it meant dropping some other illustrious career, because they cared about trying to make things, digital things primarily, substantially better than what was available at the time. And by and large they did this by listening to real people doing real things, in real contexts.. Simple, but almost unheard of at the time.
The field of UX has matured a lot over time but there’s still a long, long way to go. If anything, good information is getting harder to find so we still have a lot more work to do."

Clearly, you have big plans for the future. You’ve just announced pretty exciting news - getting an investor, Pioneer Capital, on board. Why now?
“We are in a big market and from the start our users have almost pulled the product out of us. It has never felt like we've needed to push anything uphill. We've grown organically to a point where we now feel comfortable that we have all the foundations in place for a truly great company. The team is hungry to have a greater impact and to grow fast — so it’s time to put some more fuel in the tank and get on with it.
Pioneer Capital is a great fit for us as they want to help us build a great company that’s fit to endure, and they’d already had us on their radar for some time.”
Sounds like good timing all-around. What kind of growth are you hoping to achieve with Pioneer Capital’s support?
“There’s been a real elegance in growing organically because you only do what is necessary and what customers absolutely appreciate. We've been growing our team at the speed of revenue growth. This means we've only really been able to hire for roles when we really need them. Now with funding, we can look ahead and hire for what we expect to need tomorrow, instead of what we needed yesterday."
Exciting times. What’s the key to keeping Optimal Workshop ahead of the game?
“Keeping our customers at heart. Many companies say it, and it’s addictive once you start doing it. Once you start listening to people and give them what they need - which isn’t necessarily what they asked for - it’s very gratifying. That's what we’re going to continue doing."
You can find out more about the NZ$10 million investment by New Zealand private equity firm, Pioneer Capital in our media release.

Taxonomy is one of those terms that can feel intimidating at first, especially when most definitions relate to classifying plants and animals. But in UX and information architecture, taxonomy has a very different – and incredibly important – meaning. Whether the concept is new to you or you’re looking to strengthen your IA foundations, this guide will demystify taxonomy and show how it supports better navigation, clearer labeling, and more intuitive user experiences.
In information architecture, taxonomy refers to how information is grouped, classified and labeled within a shared information environment. The overarching structure of that shared information environment is the information architecture (IA) and we find our way around it using the navigation. Think of an IA as a house. The taxonomy determines which pieces of furniture belong in each room and we navigate around the house via doorways and hallways. It all fits together to create one shared environment.
For a website architecture example, think of an online shoe store. The shoes might be organized and labelled by color, size, style, season or collection – that’s the taxonomy. The overall picture of where those groups of shoes live is the IA and in our pursuit of new shoes, we might navigate that structure via a navigation bar at the top of the page. In the amazing Grand Taxonomy of Rap Names visualization below, we can see how the information is categorized, connected and labeled through the lines and the colors. There’s no structure or hierarchy to it yet; that would be the next step in the process to build the IA.

There are so many different ways to carve information up into a taxonomy and the key drivers for determining that are your content and, of course, your users. Your taxonomy needs to make sense to your users.You may be starting from scratch with a new website or you may have inherited a taxonomy that for whatever reason just isn’t fit for purpose. The first step when creating an initial taxonomy is to do a comprehensive audit of your content. Ask yourself, is your content relevant? Is it up-to-date? Is it all necessary? Are there opportunities to delete or condense content? Once you have your content sorted, you’re ready to move on to the next step of running a card sort with users. Running a card sort early in your taxonomy creation process will allow you to build it up from an evidence based foundation. There’s no point guessing then testing and potentially going back to square one, when you can co-create with your users and then test that informed approach to validate and further evolve your thinking.When you’re designing your card sort, you’ll need to decide if you’re going to do an open, closed or hybrid sort. Here’s a very high level look at what each type involves:
This early in the taxonomy creation process, it’s best to start out with an open card sort. Not only will this tell you how your users expect your content to be grouped, but will also provide insight into the language and labels that they would expect that content to be associated with. You never know, an open card sort may even surface something you hadn’t considered. At this stage of the process, it’s important to be open to ideas and new possibilities and an open card sort will do just that. Once you’ve settled on the type of card sort you’ll be running, you’ll need to test which can be done through a tool such as Optimal's Card Sorting. It enables you to run unmoderated card sorts remotely (or print out cards for a moderated/in-person card sort!). After your participants have completed your card sort, you can access the benefits of Optimal's powerful result analysis functions.
Learn more about running a card sort and more through our 101 guide.
After you’ve run your initial open card sort with users, you should have everything you need to create the first iteration of your taxonomy. Consider everything you learned during the card sort and cross reference that with your business goals and any tech constraints you might be facing. Don’t stress too much about nailing it this time around, remember this is the first iteration and as you test more and learn more, you can make changes. Build out your taxonomy in Post-it notes with a team and then whack it into a spreadsheet to make future testing and iteration activities easier.
Now that you have the first iteration of your taxonomy, it’s time to have a go at structuring those groups into an IA and running a tree test. A tree test works like a card sort but in reverse – it allows you to test your thinking by working backwards. Optimal’s Tree Testing is an online tree testing tool that helps you assess the findability of your content without any visual design elements. All you need are clear objectives for what you’d like to learn more about and a spreadsheet version of your draft IA (told you it would come in handy!).
Learn more about Tree Testing and tree testing through our equally handy 101 guide.
Another way to test your taxonomy thinking is to run another card sort. However this time, a hybrid or a closed card sort might be more suitable. A closed card sort would be useful if you’ve got evidence to suggest that your group labels are making sense to users but you’re not 100% sure what belongs in each group. A hybrid sort will let you go one step further and tell you if your content does in fact fit within those labels and if not you’ll also pick up some new ideas to iterate your taxonomy further.
Developing a taxonomy is much like any other design process: involve your users early, test your assumptions, and continuously refine your structure as your product and content evolve. Taxonomies aren’t limited to digital experiences – we encounter them everywhere, from libraries to supermarkets – and they all serve the same purpose: helping people find what they need quickly and understand how information relates.
In information architecture, it’s the role of UX designers and information architects to shape these systems so they feel intuitive, scalable, and aligned with real user mental models. When grounded in user research and iterated over time, a strong taxonomy becomes the foundation of clear navigation, meaningful labels, and a more discoverable, user-friendly experience.
As the fourth issue of CRUX goes to press the demand for usability continues to grow, along with the rise of the digital experience economy. Sharing a sense of community among UXers is more important than ever. That’s why we’re so proud to bring you our latest issue of CRUX, celebrating people and perspectives from the UX community.
CRUX #4 has a great line-up of contributors, all experts in their fields who jumped at the opportunity to share their thoughts and ideas with us - and of course more importantly - you.
This issue we’ve focussed on collaboration and invited our contributors to bring their thoughts and ideas on communication and teamwork to the table. They’ve come up with some compelling reading that inspires, surprises and at times challenges current thinking and offers fresh perspectives.
"In a word: your findings virtually do not exist if you don’t communicate them well."
“Designers are just as vulnerable to the blindspots and errors of cognitive bias as the people who use our products. After all, we're humans,too.”
“As we live in a world of rapid digital transformation we can't continue to design in the same way we designed before. We should start designing for inclusion. For that to happen we need to shift our mindset towards inclusive research.”
Do you have a burning idea to share or a conversation you’re dying to kickstart that’s of interest to the world of UX? Now’s your chance. We’re already on the lookout for contributors for our first edition of CRUX for 2022. To find out more please drop us a line
But for now, get comfortable and settle in for a good read. Welcome to CRUX #4.
Having access to the specialist subscription-based tools you need to do your work is a reasonable thing to expect. But what if you’re relying on someone else’s SaaS account to access what you need? Sounds like a good solution but think again. It’s risky - even fraught. Here are 3 good reasons to avoid shared login credentials and why you need your own.
If you don’t know who’s signed up and using the subscriptions your organization pays for and holds, how can you protect their data once they’ve gone? As the account holder, you’re responsible for keeping the personal data of anyone accessing your subs safe and secure. That’s not only the right thing to do - it’s pretty important from a legal perspective too.
In today’s data-driven world safeguards around privacy and security are essential. You only need to look at the fallout from serious data breaches around the world to see the damage they can do. There’s a myriad of privacy laws around personal data out there but they’re based on the universal principle of protecting personal data. One of the better-known laws is GDPR the EU’s data protection law.
The General Data Protection Regulation (GDPR) regulates and protects the processing of the personal information of EU citizens and residents by establishing rules on how organizations such as companies and governments can process this personal data. It’s important to note the GDPR applies to those handling the data whether they’re EU-based organizations or not.
Avoid encouraging shared logins in your organization to ensure peace of mind that you’re doing everything you can to keep people’s personal data safe and secure - as well as keeping on the right side of the law.
Having single logins rather than shared logins saves time and energy and makes the whole administration smoother and easier for everyone.
For instance, maybe you need to delete data as part of honoring GDPR rules. This could be tricky and time consuming if there are multiple users on one email as a generic email isn’t specific to a person.
Generic email addresses also make it harder for SaaS providers to understand your account activity and implement the changes you want or need. For example, customers often ask to retrieve information for account billing. Having multiple employees using a single login can make this problematic. It can be a real struggle to identify the right owners or users.
And if the ‘champion’ of the tool leaves your organization and you want to retrieve information on the account, your SaaS provider won't be able to do this without proof you’re the real owner of this account.
Another added benefit ,(which your IT & security team will thank you for), of having a personal login, is the way it makes setting up functionality such as single-sign-on (SSO) so easy. Given the way single sign-on works, shared emails just don’t cut it anymore. Also if your organization uses SSO it means you’ll be able to log into tools more quickly and easily.
When things go wrong or you just need help using products or tools from your friendly SaaS it’s important for them and for you, that they’re in the best position to support you. Supporting people is a big part of the job and generic emails make it harder to connect with customers and create the people to people relationships that enable the best outcome when problems arise or training or help is needed.
You may be surprised to hear what a blocker multiple users on a single email can be. For instance, generic email addresses can make it harder for us to get to the right person and communicate with you. We won’t know if you have another email active in the system we can use to help you.
We’ve given you 3 good reasons not to account share - still, need convincing?
What about getting the right plan to meet your organization’s needs - so you don’t need to share in the first place? There could be all kinds of reasons why you’ve ended up having to account share: maybe a workmate signed up, shared it, and got you hooked too. Or your organization has grown and you need more subs. Whatever the reason there’s no need to account share - get in touch and sound us out to find a better, safer solution.
