Subscribe to OW blog for an instantly better inbox
Oops! Something went wrong while submitting the form.
Articles and Podcasts on Customer Service, AI and Automation, Product, and more
.webp)
Nearly 18 years ago, Optimal helped define what UX research could be, pioneering practices and tools that would become industry standard and change how teams worldwide better understand their users. As the industry has evolved, so has Optimal, expanding the platform, advancing participant recruitment, and building Optimal Intelligence AI to accelerate insight to action.
Now, we’re at the edge of another major shift. With the launch of the Model Context Protocol (MCP), we’re entering a new realm, moving from traditional research workflows to AI-powered intelligence.
Research data is one of the most valuable assets in any organization, but until now, it has been scattered across studies and reports, time-consuming to search and synthesize, and different to search or reuse. MCP now changes that for research teams.
Model Context Protocol (MCP) enables you to connect your Optimal research directly to AI tools, like ChatGPT, Claude, or Cursor, to explore and analyze your data seamlessly. Insights can go beyond data downloads, dashboards, or static reports. Access your insights and explore further with natural conversation.
Get instant insights for questions like:
With MCP-connected tools, you can:
The evolution is clear.
We started by helping teams understand users through early UX research methods.
We helped formalize how research is conducted, analyzed, and shared.
And now, with MCP in Optimal, we’re helping teams move beyond analysis altogether toward conversational, AI-driven research intelligence.
Log in to Optimal, connect with your AI tools, and get the most value from your research or book a demo to start building your research repository with Optimal.
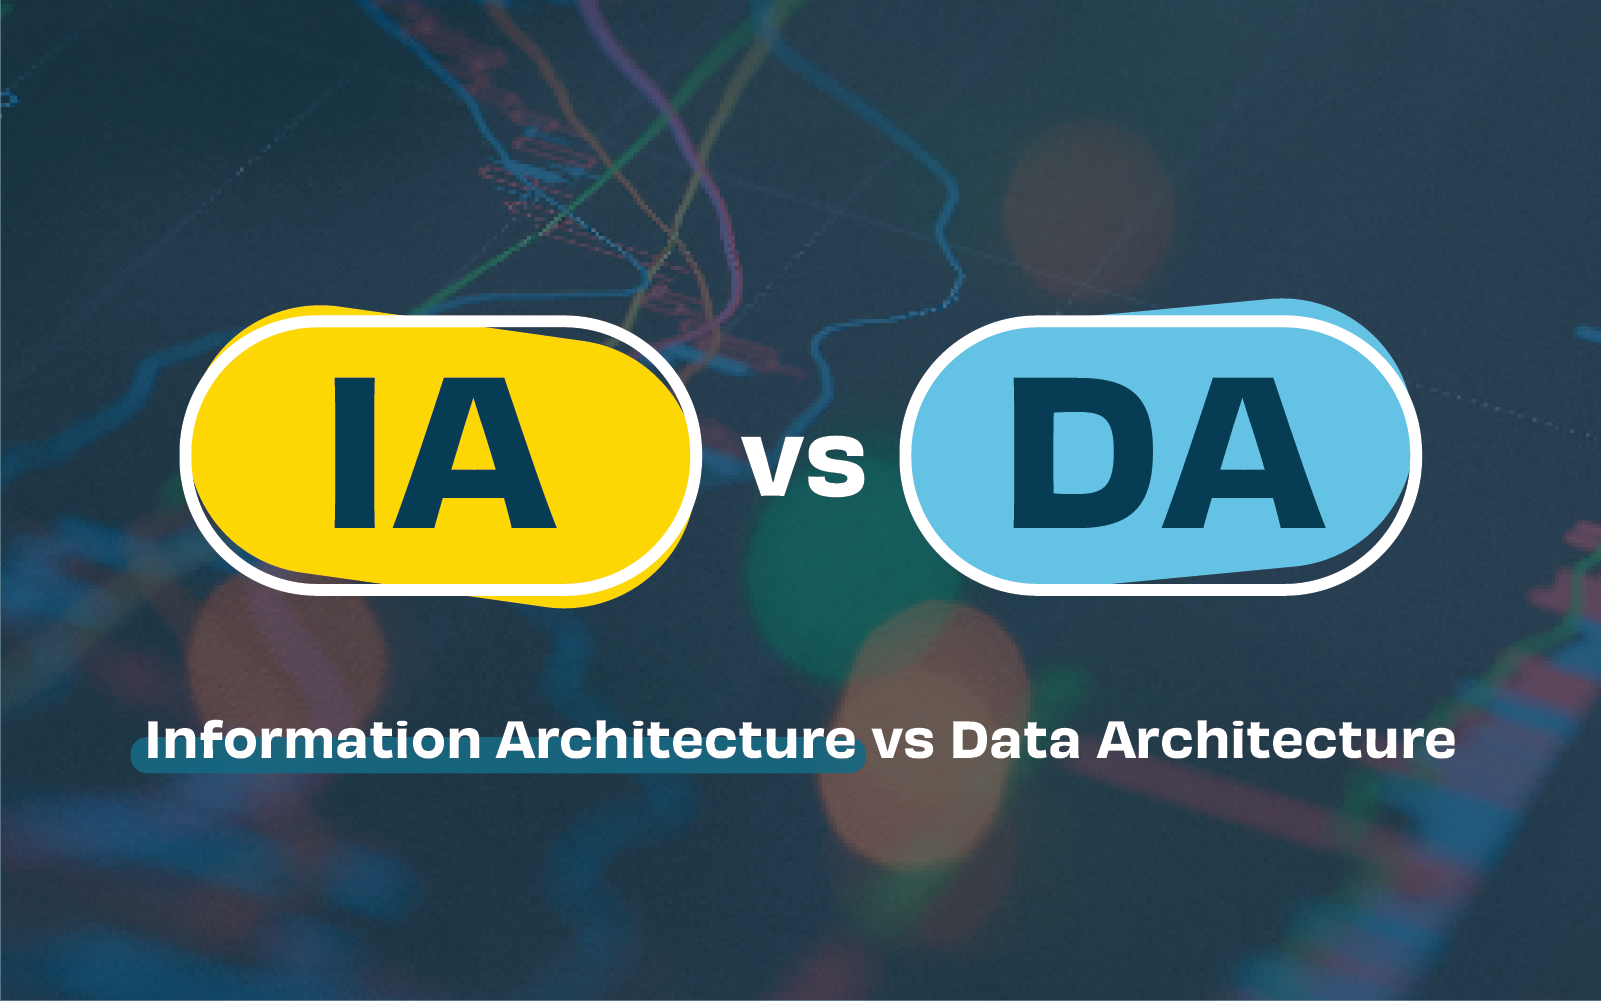
Thanks to an ever-growing digital world, businesses are spoiled for information and data. The more complex the business, the more information there is and the more complicated the business requirements are. But where there are challenges, there is opportunity. That’s where information architecture and data architecture come in.
Information and data architecture both seek to make sense of the plethora of information a business handles. However, the two have different roles to play in the way businesses use, move, maintain, and present data - both to internal and external stakeholders. So what are they and why should businesses take note?
Information architecture is the structure used to organize and label content on websites, mobile applications and other digital environments. Its primary purpose is to enhance user experience by ensuring information is structured in an accessible, usable and relevant way.
Information architecture seeks to understand user needs and goals by analyzing both existing and required information, then building an information framework in a logical and user-friendly way. It deals with three main components:
Whilst this information sits in the background, it’s the layer upon which you build the design of your digital products.
Information architects bring data from file systems and databases to life by building meaningful narratives and stories. Outputs can include site-mapping, information architecture diagrams and content inventories. These outputs are supported by user research techniques such as card sorting, tree testing, user surveys and first-click testing.
Data architecture bridges the gap between business needs, goals, and system requirements related to data handling. It sets out a framework for managing data assets, the flow of data and the maintenance of data systems. As such, it has a slightly more macro view than information architecture and concerns itself with emerging technologies such as artificial intelligence, machine learning, and blockchain.
Where information architecture centers around the end-user interaction, data architecture centers around practical handling and operation of data processes i.e. collection through to transformation, distribution, and consumption. Because of this, data architecture must take into account the businesses ability to scale operations, integrate with third party systems, support real-time data processes and the reduction of operating costs. Modern data architecture may point to artificial intelligence to tackle some of these challenges.
Enterprise architects are big-picture people. Data architecture and information architecture both fall within their remit, and they often oversee other data management job specialities within an IT department.
As a leader (and often, visionary) within a business, enterprise architects shoulder the responsibility of ‘mission critical’ projects. As a result, they tend to have several years experience with IT systems, backed by a bachelor’s degree in computer science, IT management, data science or similar. Many will hold a master’s degree and specialty certifications.
The role involves collaborating with senior business leaders, solution-delivery teams and external stakeholders, and requires creative problem solving and excellent communication skills. Therefore, enterprise architects very much steer the ship when it comes to information and data architecture. Combining high-level business strategy with knowledge of ‘the nuts and bolts’ of IT data systems and processes, they command an annual salary in New Zealand between $150,000 and $200,000 per annum..
Continuous improvement within any business that has substantial IT infrastructure calls for serious investment in enterprise architecture.
Once overarching business goals are aligned with the scope of data and system requirements, information and data architecture design (or redesign) can begin.
Crucial to the design and implementation process is developing an architecture framework. This is a set of guidelines that lays out principles, practices, tools and approaches required to complete the design. It supports system design decisions, assigns key tasks and provides project guidance throughout the design process. The framework essentially aims to unite disparate teams and maintain business and IT alignment.
The choice of architecture design is also critical. It should consider scalability, performance, maintainability and adaptability to emerging technology. Which is why cloud platforms feature so heavily in modern data architecture. Cloud architects will navigate the architecture design and technical requirements of cloud-based delivery models, which offer the solution to those scalability and adaptability challenges. They are responsible for bridging the gaps between complex business problems and solutions in the cloud. Modern data architecture tends to involve some form of cloud delivery component.
Throughout implementation, data and information architects will work closely with designers and engineers until testable architecture is ready. User research and testing will be carried out, and a feedback loop will commence until requirements are met. Users, as always, should be at the center of your digital product.
Whilst the difference between information and data architecture can appear nuanced on the surface, they hold unique roles when delivering a cohesive, user-friendly digital product.
Think of a sliding scale where business operations sit at one end, and users sit at the other. Data architecture addresses challenges closer to the business: aligning business requirements and goals with how data flows through the system. On the other hand, information architecture addresses the challenges related to how this data is organized and interpreted for the end user.
At the end of the day, both information and data architecture need to work in harmony to satisfy the user and the business.
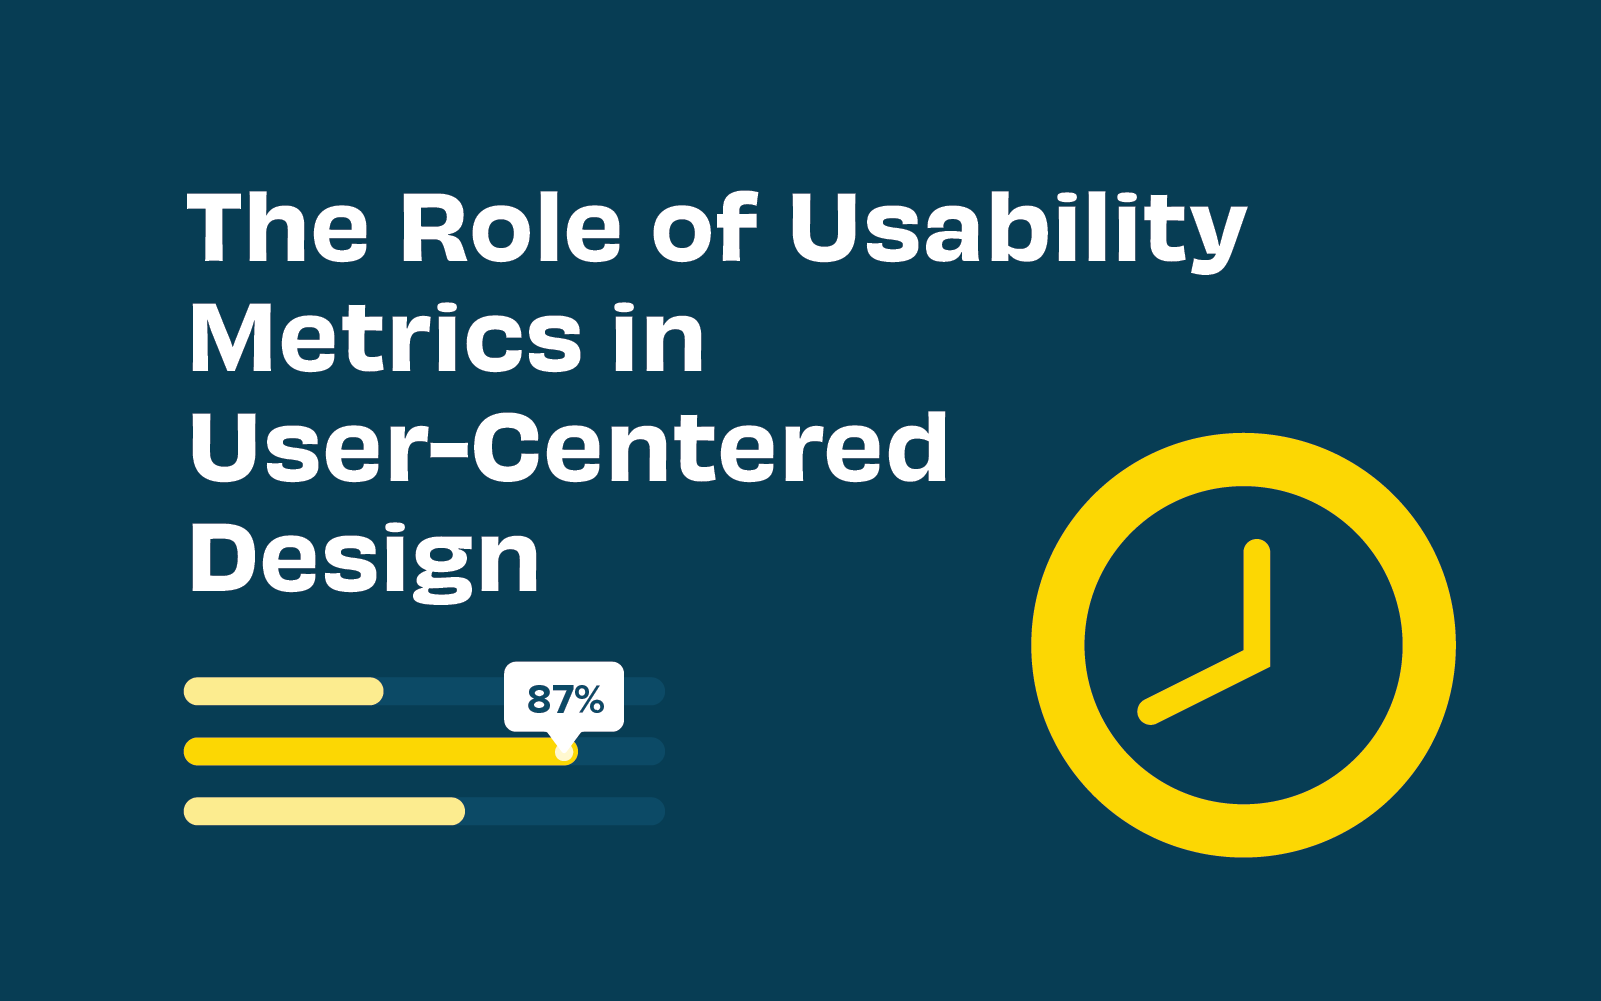
The term ‘usability’ captures sentiments of how usable, useful, enjoyable, and intuitive a website or app is perceived by users. By its very nature, usability is somewhat subjective. But what we’re really looking for when we talk about usability is how well a website can be used to achieve a specific task or goal. Using this definition we can analyze usability metrics (standard units of measurement) to understand how well user experience design is performing.
Usability metrics provide helpful insights before and after any digital product is launched. They help us form a deeper understanding of how we can design with the user front of mind. This user-centered design approach is considered the best-practice in building effective information architecture and user experiences that help websites, apps, and software meet and exceed users' needs.
In this article, we’ll highlight key usability metrics, how to measure and understand them, and how you can apply them to improve user experience.
Usability metrics aim to understand three core elements of usability, namely: effectiveness, efficiency, and satisfaction. A variety of research techniques offer designers an avenue for quantifying usability. Quantifying usability is key because we want to measure and understand it objectively, rather than making assumptions.
There are a few key metrics that we can measure directly if we’re looking to quantify effectiveness, efficiency, and satisfaction. Here are four common examples:
Usability metrics are outputs from research techniques deployed when conducting usability testing. Usability testing in web design, for example, involves assessing how a user interacts with the website by observing (and listening to) users completing defined tasks, such as purchasing a product or signing up for newsletters.
Conducting usability testing and collecting usability metrics usually involves:
Tools such Reframer are helpful in conducting usability tests remotely, and they enable live collaboration of multiple team members. It is extremely handy when trying to record and organize those insightful observations! Using paper prototypes is an inexpensive way to test usability early in the design process.
User-centered design challenges designers to put user needs first. This means in order to deploy user-centered design, you need to understand your user. This is where usability testing and metrics add value to website and app performance; they provide direct, objective insight into user behavior, needs, and frustrations. If your user isn’t getting what they want or expect, they’ll simply leave and look elsewhere.
Usability metrics identify which parts of your design aren’t hitting the mark. Recognizing where users might be having trouble completing certain actions, or where users are regularly making errors, are vital insights when implementing user-centered design. In short, user-centered design relies on data-driven user insight.
But why hark on about usability metrics and user-centered design? Because at the heart of most successful businesses is a well-solved user problem. Take Spotify, for example, which solved the problem of dodgy, pirated digital files being so unreliable. People liked access to free digital music, but they had to battle viruses and fake files to get it. With Spotify, for a small monthly fee, or the cost of listening to a few ads, users have the best of both worlds. The same principle applies to user experience - identify recurring problems, then solve them.
Usability metrics should be analyzed by design teams of every size. However, there are some things to bear in mind when using usability metrics to inform design decisions:
Remember, data analysis is only as good as the data itself. Give yourself the best chance of designing exceptional user experiences by collecting, researching, and analyzing meaningful and accurate usability metrics.
Usability metrics are a guiding light when it comes to user experience. As the old saying goes, “you can’t manage what you can’t measure”. By including usability metrics in your design process, you invite direct user feedback into your product. This is ideal because we want to leave any assumptions or guesswork about user experience at the door.
User-centered design inherently relies on constant user research. Usability metrics such as success rate, time-based efficiency, number of errors, and post-task satisfaction will highlight potential shortcomings in your design. Subsequently, they identify where improvements can be made, AND they lay down a benchmark to check whether any resulting updates addressed the issues.
Ready to start collecting and analyzing usability metrics? Check out our guide to planning and running effective usability tests to get a head start!
Your cards have been sorted, and now you have lots of amazing data and insight to help improve your information architecture. So how do you interpret the results?
Never fear, our product ninjas Alex and Aidan are here to help. In our latest live training session they take you on a walk-through of card sort analysis using OptimalSort.
What they cover:
In our latest live training session product experts, Pete and Caitlin, take us on a deep dive into the new and improved qualitative analysis tool Reframer.
The session is loaded with tips and demo’s on how to save time and streamline your qualitative research all within one tool. They also discuss best practices for setting up and conducting user interviews, and how to get the most out of your analysis.

Every month we have fun and informative “bite sized” presentations to add some inspiration to your lunch break. These virtual events allow us to partner with amazing speakers, community groups and organizations to share their insights and hot takes on a variety of topics impacting our industry.
Join us at the end of every month for Lunch n' Learn.
Leading design processes amidst a world in transition requires all practitioners to continuously invest in their own development. One aspect worth investing in, is an ability to integrate holistic thinking into our design leadership practice. This includes re-evaluating our own biases and how that bias is reflected in the tools we choose to work with when understanding and designing for/within complex systems.
Recently our guest Susanna Carman, Strategic Designer and founder of Transition Leadership LAB, introduced us to a holistic approach to qualitative design research using Ken Wilber’s 4 Quadrant Model. Susanna explained the fundamental principles underpinning the framework, and showed how it can be used to ensure a multi-perspectival harvest of critical qualitative and quantitative data on any design project.
Susanna Carman is a Strategic Designer and research-practitioner who helps people solve complex problems, the types of problems that have to do with services, systems and human interactions. Specialising in design, leadership and learning, Susanna brings a high value toolkit and herself as Thinking Partner to design, leadership and change practitioners who are tasked with delivering sustainable solutions amidst disruptive conditions.
Susanna holds a Masters of Design Futures degree from RMIT University, and has over a decade of combined experience delivering business performance, cultural alignment and leadership development outcomes to the education, health, community development and financial services sectors. She is also the founder and host of Transition Leadership Lab, a 9-week learning lab for design, leadership and change practitioners who already have a sophisticated set of tools and mindsets, but still feel these are insufficient to meet the challenge of leading change in a rapidly transforming world.
Grab your lunch, invite your colleagues and we hope to see you at our next Lunch n' Learn 🌯🍱🍜🍲
If you missed our live training, don’t worry, we’ve got you covered! In this session, our product experts Katie and Aidan discuss why, how and when to benchmark an existing structure using Treejack.
They also talk through some benchmarking use cases, demo how to compare tasks between different studies, and which results are most helpful.
