Subscribe to OW blog for an instantly better inbox
Oops! Something went wrong while submitting the form.
Articles and Podcasts on Customer Service, AI and Automation, Product, and more
The pace of product development has never been faster, and the cost of building on assumptions has never been higher. At Optimal, we've spent nearly two decades helping teams get closer to their users, and what we're seeing right now is a fundamental shift in how research gets done. More teams are running research than ever before and timelines to act on findings are tighter, while the expectations for what research needs to deliver keep rising.
That shift is exactly what's driving Optimal 3.0, our most ambitious reinvention of the platform yet, designed to give every team the speed, depth, and flexibility that modern research demands. Today's release is the next step in that journey.
Optimal's new mixed-methods research tool tears down the boundaries between methods. It brings prototype testing, live site testing, and surveys into a single, end-to-end study workflow. And grounded in our product principles: speed to insights, access for all, and communication.
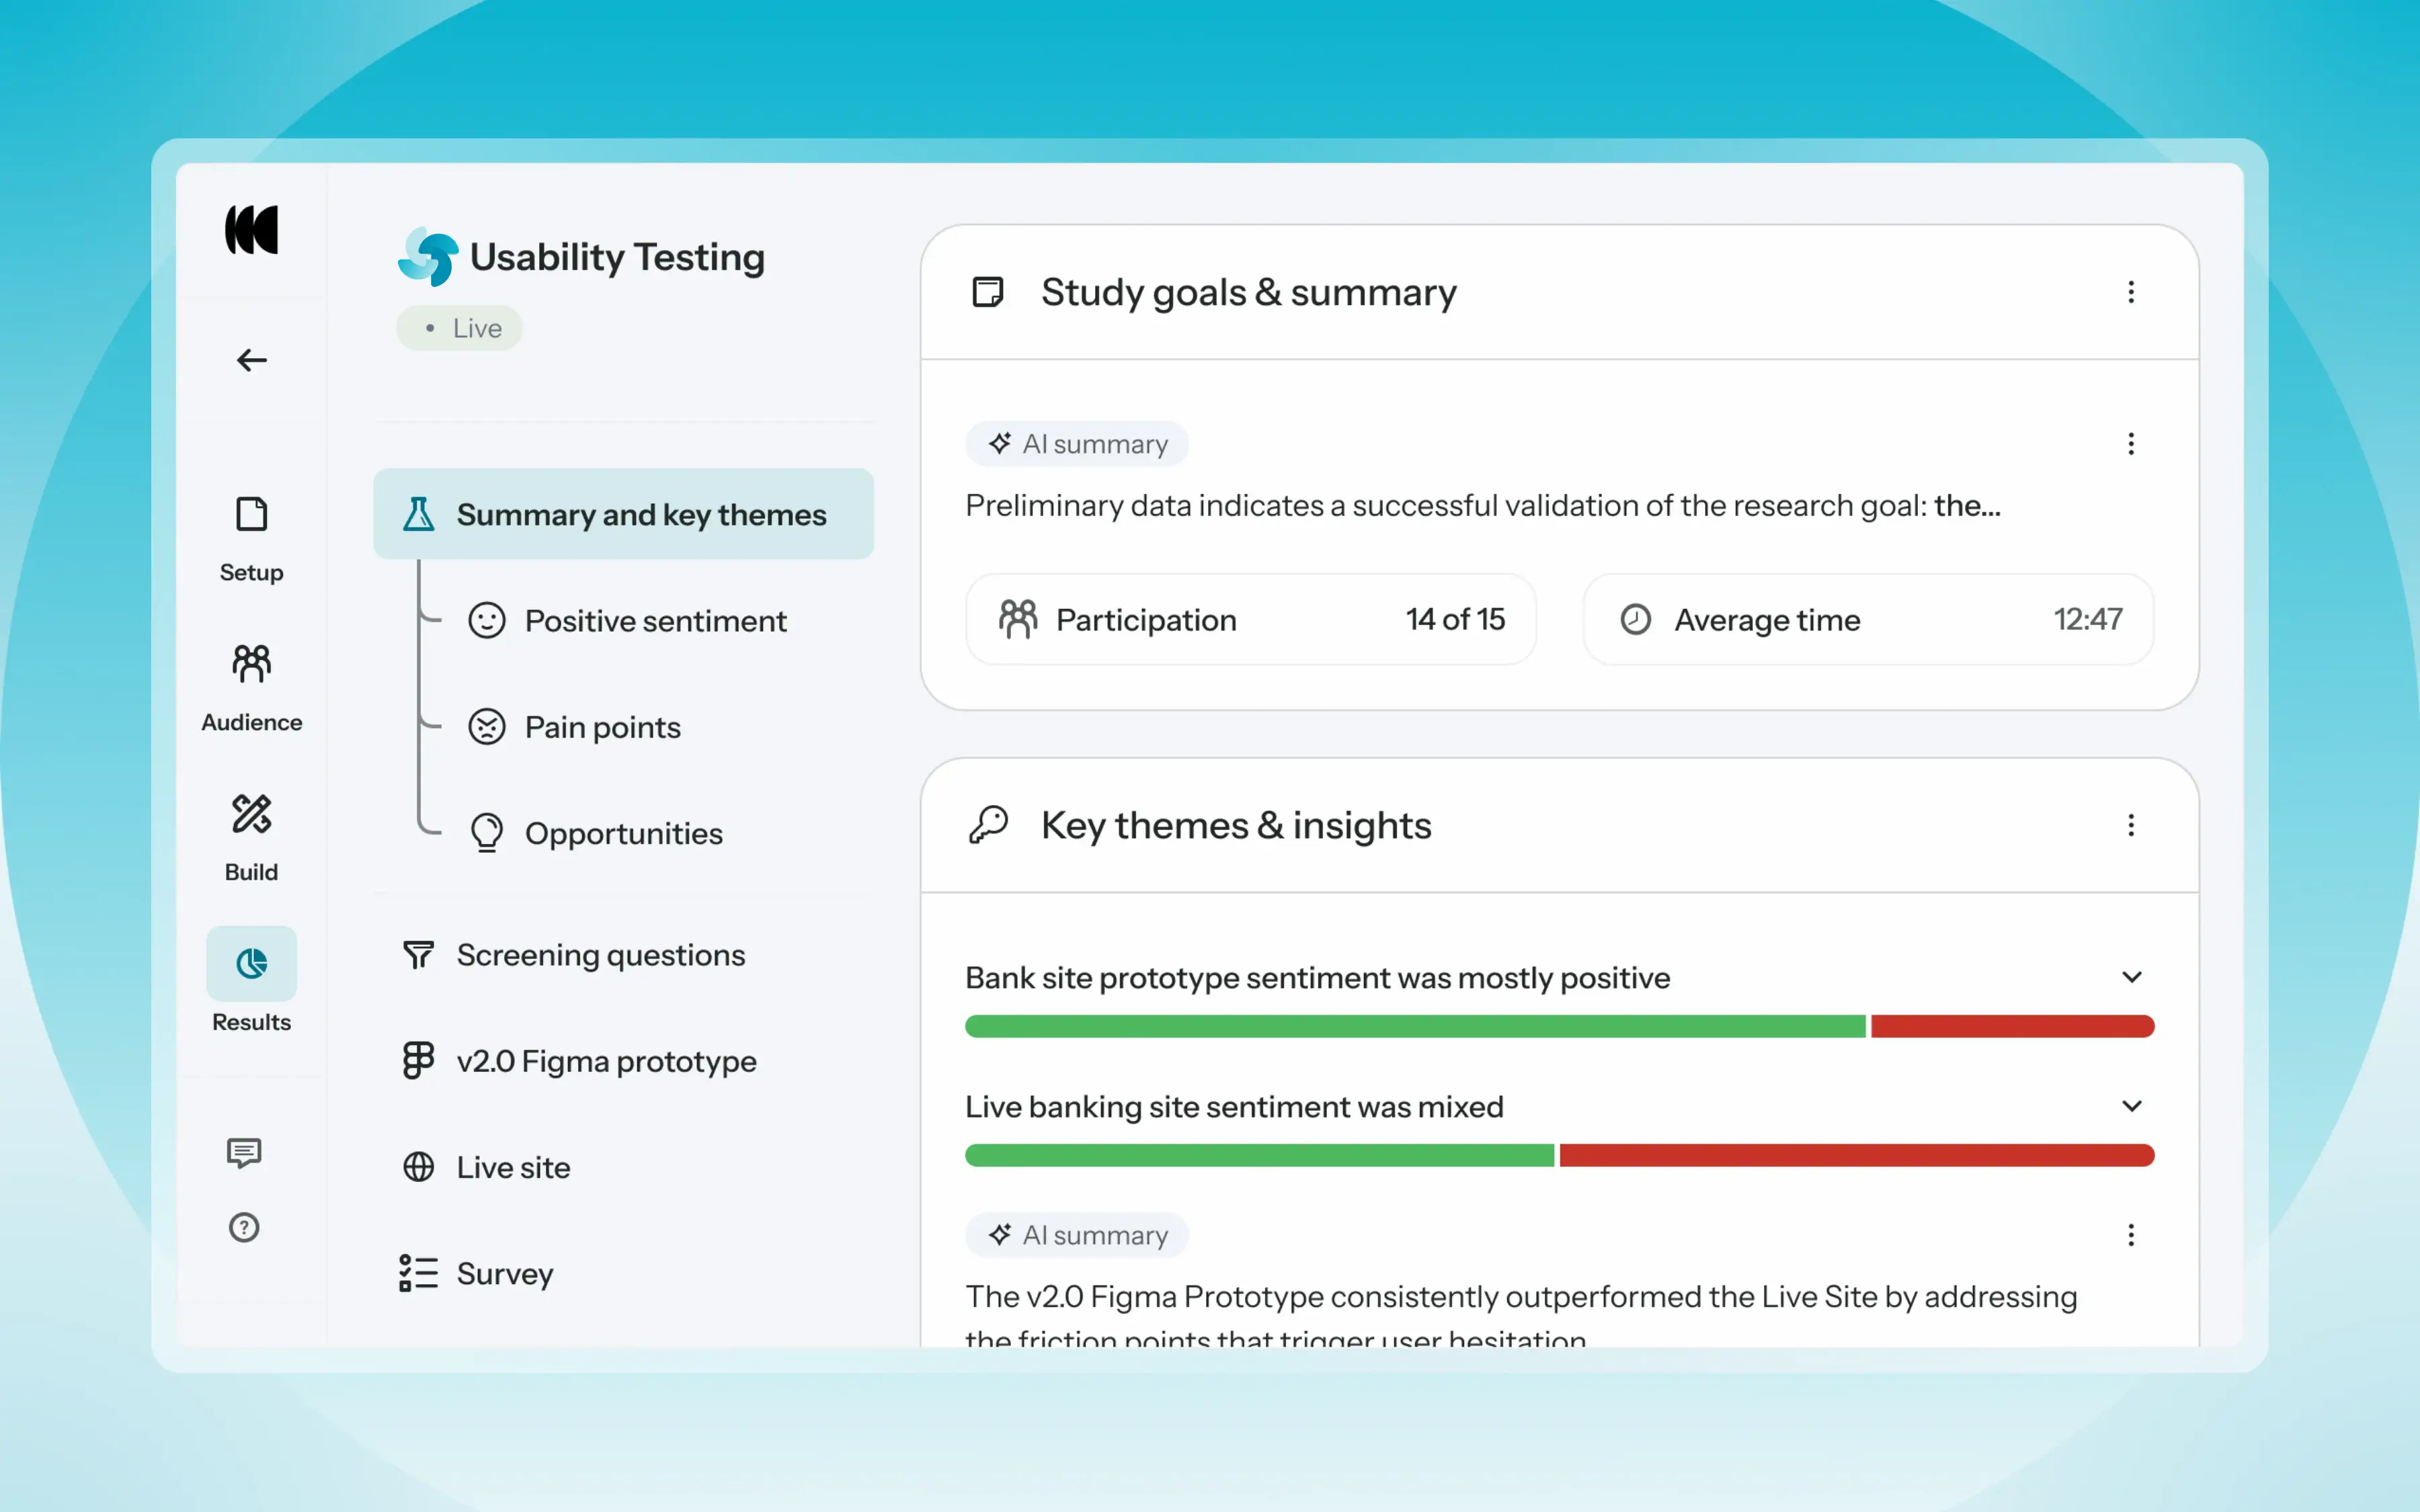
Optimal’s new Usability Testing tool marks the next step in the evolution of Optimal 3.0, giving teams the flexibility to evaluate experiences in whatever form they exist today.
Combine prototype testing, AI prototype testing, live site testing, and surveys in a single study. Test multiple prototypes side by side, compare different live URLs, or mix prototype and live site tasks together all in one workflow. Research can now mirror how products actually evolve, from early concept to shipped experience.
New speak-aloud question types, custom message blocks, auto-generated transcripts and insights, citations and highlight clips help you capture the context and reasoning behind every action. AI-assisted analysis then helps you make sense of it all fast and communicate with impact.
Review a study overview surfacing key themes, pain points, and sentiment analysis combining insights across all your study methods along with detailed results, task analysis and recordings, transcripts, key quotes, and automatically generated citations and video clips.
Coming soon: you can also use AI Chat to chat with your data directly, asking questions and pulling new insights and evidence across all your qualitative and quantitative inputs.
Modern product development is no longer linear. Teams continuously move between:
Traditional usability testing tools were not built for this fluidity. Optimal’s Usability Testing brings the flexibility to match how teams actually work today.
By combining multiple methods into a single study and pairing it with AI-powered synthesis, Usability Testing helps teams reduce setup and analysis time, recruit once, capture richer qualitative context, compare experiences more easily, move faster from feedback to action, and tell clearer, more compelling insight stories.
Learn how to get started with Usability Testing in Optimal and accelerate your path from idea to insight. Book a meeting, start exploring in your account, or join our live training webinar on June 24th to see it in action.

The traditional product development process is a linear one. Research discovers insights, passes the baton to design, who creates solutions and hands off to product management, who delivers requirements to engineering. Clean. Orderly. Completely unrealistic in today’s modern product development lifecycle.
The old workflow assumed each team had distinct phases that happened in sequence. Research happens first (discover users problems), then design (create the solutions), then product (define the specifications), then engineering (build it). Unfortunately this linear approach added weeks to timelines and created information loss at every handoff.
Smart product teams are starting to approach this differently, collapsing these phases into integrated workflows:
In leading organizations, these collaborative workflows are already the norm and we’re seeing this more and more across our customer base. The teams managing it the best, are focusing on make these changes intentional, rather than letting them happen chaotically.
As product development accelerates, the teams winning aren't those with the best researchers, designers, or product managers in isolation. They're organizations where these teams work together, where expertise is shared, and where the entire team owns the user experience.
When we first think of a beautiful website or app design, we rarely think of content structures, labels, and categories. But that’s exactly where great design and seamless user experiences begin. Beneath fancy fonts, layout, colors, and animations are the real heroes of user-centric design - information architecture and navigation.
Information architecture (IA) is like the blueprint of your website or app - it’s a conceptual content structure of how content is organized and arranged to create seamless interactions. And as useful as your information may be, if your navigation is flawed, users won’t be able to find it. They’ll simply leave your site and look elsewhere.
So, how does navigation and information architecture complement each other to create seamless user experiences?
Information architecture refers to the practice of organizing, structuring, and labeling content and information to enhance the user's understanding and navigation of a website or application. It involves designing an intuitive, user-friendly, and efficient system to help users find and access the information they need easily. Good IA is essential for delivering a positive user experience and ensuring that your users can achieve their goals effectively.
IA is often confused with navigation structure. Navigation is a part of IA, and it refers to the way users move through a website or application. IA involves more than navigation; it encompasses the overall organization, labeling, and structure of content and information.
There are three key components of IA:
Navigation refers to the process of providing users with a means of moving through a website or application to access the information they need. Navigation is an integral part of IA, as it guides users through the organizational structure and content structure of a site, allowing them to find and access the information they require efficiently.
There are several types of navigation, including utility navigation and content navigation. Utility navigation refers to the elements that help users perform specific actions, such as logging in, creating an account, subscribing, or sharing content. Content navigation, on the other hand, refers to the elements used to guide users through the site's content, such as menus, links, and buttons.
Both types of navigation provide users with a roadmap of how the site is organized and how they can access/interact with the information they need. Effective navigation structures are designed to be intuitive and easy to use. The goal is to minimize the time and effort required for users to find and access the information they need.
The key elements of effective navigation include clear labeling, logical grouping, and consistency across the site.
Since navigation structures need to be intuitive and easy to use, it goes without saying that usability testing is central to determining what is deemed ‘intuitive’ in the first place. What you might deem intuitive, may not be to your target user.
We’ve discussed how clear labeling, logical grouping, and consistency are key elements for designing navigation, but can they be tested and confirmed? One common usability test is called card sorting. Card sorting is a user research technique that helps you discover how people understand, label and categorize information. It involves asking users to sort various pieces of information or content into categories. Researchers use card sorting to inform decisions about product categorization, menu items, and navigation structures. Remember, researching these underlying structures also informs your information architecture - a key factor in determining good website design.
Tree testing is another invaluable research tool for creating intuitive and easy to use navigation structures. Tree testing examines how easy it is for your users to find information using a stripped-back, text-only representation of your website - almost like a sitemap. Rather than asking users to sort information, they are asked to perform a navigation task, for example, “where would you find XYZ product on our site?”. Depending on how easy or difficult users find these tasks gives you a great indication of the strengths and weaknesses of your underlying site structure, which then informs your navigation design.
Combine usability testing and the following tips to nail your next navigation design:
Both information architecture and navigation design contribute to great user experience (UX) design by making it easier for users to find the information they need quickly and efficiently. Information architecture helps users understand the relationships between different types of content and how to access them, while navigation design guides users through the content logically and intuitively.
In addition to making it easier for users to find information, great information architecture and navigation design can also help improve engagement and satisfaction. When users can find what they're looking for quickly and easily, they're more likely to stay on your website or application and explore more content. By contrast, poor information architecture and navigation design can lead to frustration, confusion, and disengagement.
So, when it comes to information architecture vs navigation, what are the best practices for design? Great navigation structure generally considers two factors: (1) what you want your users to do and, (2) what your users want to do. Strike a balance between the two, but ultimately your navigation system should focus on the needs of your users. Be sure to use simple language and remember to nest content into user-friendly categories.
Since great navigation design is typically a result of great IA design, it should come as no surprise that the key design principles of IA focus on similar principles. Dan Brown’s eight design principles lay out the best practices of IA design:
Information architecture and navigation are the unsung heroes of website design that work in synchrony to create seamless user experiences. Information architecture refers to the practice of organizing and structuring content and information, while navigation guides users through the site's structure and content. Both are integral to creating intuitive user experiences.
In many ways, navigation and information architecture share the same traits necessary for success. They both require clear, logical structure, as well as clear labeling and categorization. Their ability to deliver on these traits often determines how well a website or application meets your users needs. Of course, IA and navigation designs should be anchored by user research and usability testing, like card sorting and tree testing, to ensure user experiences are as intuitive as possible!
That’s where Optimal comes in. As the world’s most loved user insights platform, Optimal empowers teams across design, product, research, and content to uncover how users think, organize, and navigate information. Tools like Card Sorting and Tree Testing help you validate and refine your IA and navigation structures with real users, so you can move from guesswork to confidence. Ready to turn user behavior into better navigation? Try Optimal for free.

Your research platform should accelerate insights, not create obstacles. Yet many enterprise research teams are discovering their tools weren't built for the scale, velocity, and quality standards that today’s product development demands.
If you're experiencing any of these five warning signs, it might be time to evaluate alternatives.
The Challenge: When platforms limit concurrent studies, research becomes a first-come-first-served bottleneck and urgent research gets delayed by scheduled projects. In fast-moving businesses, research velocity directly impacts competitiveness. Every queued study is a delayed product launch, a missed market opportunity, or a competitor gaining ground.
The Solution: Enterprise-grade research platforms allow unlimited concurrent studies. Multiple teams can research simultaneously without coordination overhead or artificial constraints. Organizations that remove study volume constraints report 3-4x increases in research velocity within the first quarter of switching platforms.
The Problem: When pricing gest too complicated, it becomes unpredictable. Some businesses have per-participant fees, usage caps and seat limits not to mention other hidden charges. Many pricing models weren't designed for enterprise-scale research, they were designed to maximize per-transaction revenue. When you can't predict research costs, you can't plan research roadmaps. Teams start rationing participants, avoiding "expensive" audiences, or excluding stakeholders from platform access to control costs.
The Solution: Transparent, scalable pricing with unlimited seats that grows with your needs. Volume-based plans that reward research investment rather than penalizing growth. No hidden per-participant markups.
The Problem: This is the most dangerous sign because it corrupts insights at the source. Low-quality participants create low-quality data, which creates poor product decisions.
Warning signs include:
Poor participant quality isn't just frustrating, it's expensive. Research with the wrong participants produces misleading insights that derail product strategy, waste development resources, and damage market positioning.
The Solution: Multi-layer fraud prevention systems. Behavioral verification. AI-response detection. Real-time quality monitoring. 100% quality guarantees backed by participant replacement policies. When product, design and research teams work with brands that offer 100% participant quality guarantees, they know that they can trust their research and make real business decisions from their insights.
The Problem: Limited panel reach forces compromises. Example: You need B2B software buyers but you get anyone who's used software. Research with "close enough" participants produces insights that don't apply to your actual market. Product decisions based on proxy audiences fail in real-world application.
The solution: Tools like Optimal that offer 10M+ participants across 150+ countries with genuine niche targeting capabilities. Proven Australian market coverage from broad demographics to specialized B2B audiences. Advanced screening beyond basic demographics.
The Problem: You chose your platform 3-5 years ago when you were a smaller team with simpler needs. But your organization has grown, research has become more strategic, and your platform's limitations are now organizational constraints. Platform limitations become organizational limitations. When your tools can't support enterprise workflows, your research function can't deliver enterprise value.
The Solution: Complete research lifecycle support from recruitment to analysis. AI-powered insight generation. Enterprise-grade security and compliance. Dedicated support and onboarding. Integration ecosystems that connect research across your organization.
Leading product, design and research teams are moving to Optimal because it's specifically built to address the pain points outlined above:
If you're experiencing any of these five signs, it's worth exploring alternatives. The cost of continuing with inadequate tools, delayed launches, poor data quality, limited research capacity, far outweigh the effort of evaluation.
Start a Free Trial – Test Optimal with your real research projects
Compare Platforms – See detailed capability comparisons
Talk to Our Team – Discuss your specific research needs with Australian experts
When evaluating tools for user testing and participant recruitment, Askable often appears on the shortlist, especially for teams based in Australia and New Zealand. But in 2025, many researchers are finding Askable’s limitations increasingly difficult to work around: restricted study volume, inconsistent participant quality, and new pricing that limits flexibility.
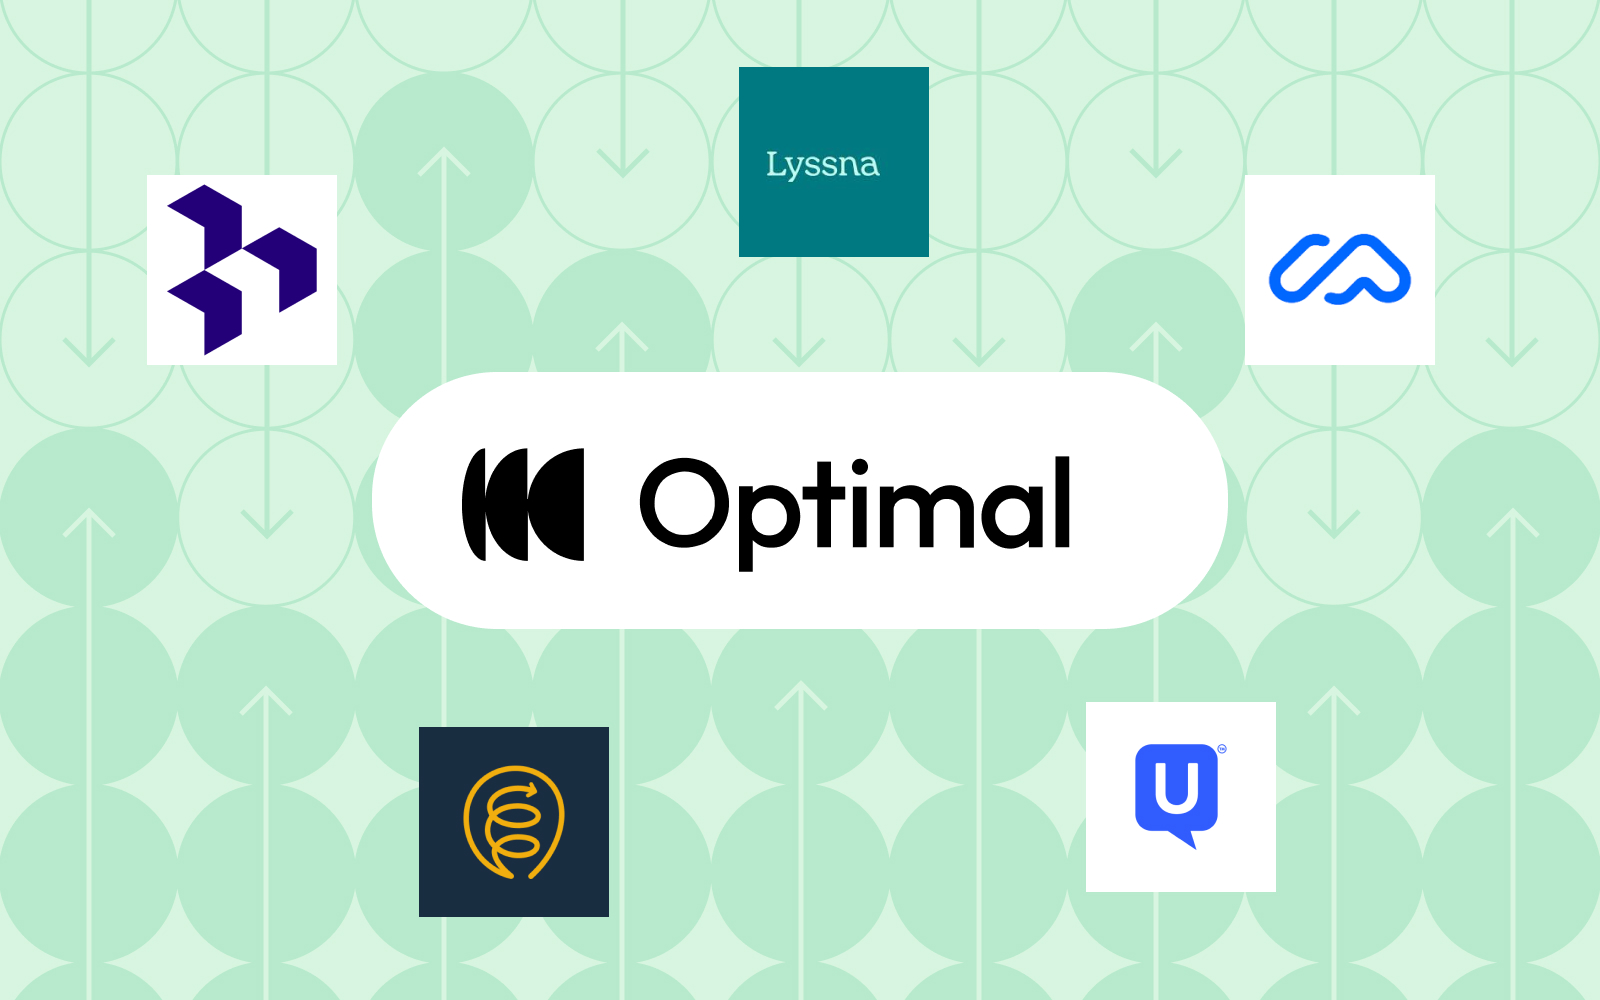
If you’re exploring Askable alternatives that offer more scalability, higher data quality, and global reach, here are five strong options.
Optimal is a comprehensive user insights platform supporting the full research lifecycle, from participant recruitment to analysis and reporting. Unlike Askable, which has historically focused on recruitment, Optimal unifies multiple research methods in one platform, including prototype testing, card sorting, tree testing, and AI-assisted interviews.
Optimal removes that bottleneck, letting you launch multiple concurrent studies across teams and research methods.
Optimal offers scalable plans with unlimited seats, so teams only pay for what they need.
Optimal provides access to over 100+ million verified participants worldwide, with strong fraud-prevention and screening systems that eliminate low-effort or AI-assisted responses.
Best for: Teams seeking an enterprise-ready, scalable research platform that eliminates the operational constraints of Askable.
UserTesting remains one of the most established platforms for moderated and unmoderated usability testing. It excels at gathering video feedback from participants in real time.
Best for: Companies prioritizing live, moderated usability sessions.
Maze offers seamless Figma integration and focuses on automating prototype-testing workflows for product and design teams.
Best for: Design-first teams validating prototypes and navigation flows.
Lyssna focuses on quick-turn, unmoderated studies such as preference tests, first-click tests, and five-second tests.
Best for: Designers and researchers running lightweight validation tests.
Dovetail is primarily a qualitative data repository rather than a testing platform. It’s useful for centralizing and analyzing insights from research studies conducted elsewhere.
Best for: Research teams centralizing insights from multiple sources.
If your goal is simply to recruit local participants, Askable can still meet basic needs. But if you’re looking to scale research in your organization, integrate testing and analysis, and automate insights, Optimal stands out as the best long-term investment. Its blend of global reach, AI-powered analysis, and proven enterprise support makes it the natural next step for growing research teams. You can try Optimal for free here.

In the field of user research, every method is either qualitative, quantitative – or both. Understandably, there’s some confusion around these 2 approaches and where the different methods are applicable. This article provides a handy breakdown of the different terms and where and why you’d want to use qualitative or quantitative research methods.
Let’s start with qualitative research, an approach that’s all about the ‘why’. It’s exploratory and not about numbers, instead focusing on reasons, motivations, behaviors and opinions – it’s best at helping you gain insight and delve deep into a particular problem. This type of data typically comes from conversations, interviews and responses to open questions. The real value of qualitative research is in its ability to give you a human perspective on a research question. Unlike quantitative research, this approach will help you understand some of the more intangible factors – things like behaviors, habits and past experiences – whose effects may not always be readily apparent when you’re conducting quantitative research. A qualitative research question could be investigating why people switch between different banks, for example.
Qualitative research is best suited to identifying how people think about problems, how they interact with products and services, and what encourages them to behave a certain way. For example, you could run a study to better understand how people feel about a product they use, or why people have trouble filling out your sign up form. Qualitative research can be very exploratory (e.g., user interviews) as well as more closely tied to evaluating designs (e.g., usability testing). Good qualitative research questions to ask include:
There’s no shortage of methods to gather qualitative data, which commonly takes the form of interview transcripts, notes and audio and video recordings. Here are some of the most widely-used qualitative research methods:
You don’t often need large numbers of participants for qualitative research, with the average range usually somewhere between 5 to 10 people. You’ll likely require more if you're focusing your work on specific personas, for example, in which case you may need to study 5-10 people for each persona. While this may seem quite low, consider the research methods you’ll be using. Carrying out large numbers of in-person research sessions requires a significant time investment in terms of planning, actually hosting the sessions and analyzing your findings.
On the other side of the coin you’ve got quantitative research. This type of research is focused on numbers and measurement, gathering data and being able to transform this information into statistics. Given that quantitative research is all about generating data that can be expressed in numbers, there multiple ways you make use of it. Statistical analysis means you can pull useful facts from your quantitative data, for example trends, demographic information and differences between groups. It’s an excellent way to understand a snapshot of your users. A quantitative research question could involve investigating the number of people that upgrade from a free plan to a paid plan.
Quantitative research is ideal for understanding behaviors and usage. In many cases it's a lot less resource-heavy than qualitative research because you don't need to pay incentives or spend time scheduling sessions etc). With that in mind, you might do some quantitative research early on to better understand the problem space, for example by running a survey on your users. Here are some examples of good quantitative research questions to ask:
Commonly, quantitative data takes the form of numbers and statistics.
Here are some of the most popular quantitative research methods:
While you only need a small number of participants for qualitative research, you need significantly more for quantitative research. Quantitative research is all about quantity. With more participants, you can generate more useful and reliable data you can analyze. In turn, you’ll have a clearer understanding of your research problem. This means that quantitative research can often involve gathering data from thousands of participants through an A/B test, or with 30 through a card sort. Read more about the right number of participants to gather for your research.
While there are certainly times when you’d only want to focus on qualitative or quantitative data to get answers, there’s significant value in utilizing both methods on the same research projects.Interestingly, there are a number of research methods that will generate both quantitative and qualitative data. Take surveys as an example. A survey could include questions that require written answers from participants as well as questions that require participants to select from multiple choices.
Looking back at the earlier example of how people move from a free plan to a paid plan, applying both research approaches to the question will yield a more robust or holistic answer. You’ll know why people upgrade to the paid plan in addition to how many. You can read more about mixed methods research in this article:
Now that you know the difference between qualitative and quantitative research, the best way to build confidence is to start testing. Hands-on experience is the fastest path to deeper insight. At Optimal, we make it easy to run your first study, no matter your role or research experience.
User research software isn't what it used to be. The days of insights being locked away in specialist UX research teams are fading fast, replaced by a world where product managers, designers, and even marketers are running their own usability testing, prototype validation, and user interviews. The best UX research platforms powering this shift have evolved from complex enterprise software into tools that genuinely enable teams to test with users, analyze results, and share insights faster.
This isn't just about better software, it's about a fundamental transformation in how organizations make decisions. Let's explore the top user research tools in 2025, what makes each one worth considering, and how they're changing the research landscape.
The shift toward all-in-one UX research platforms reflects a deeper need: teams want to move from idea to insight without juggling multiple tools, logins, or data silos. A truly comprehensive research platform combines several key capabilities within a unified workflow.
The best all-in-one platforms integrate study design, participant recruitment, multiple research methods (from usability testing to surveys to interviews to navigation testing to prototype testing), AI-powered analysis, and insight management in one cohesive experience. This isn't just about feature breadth, it's about eliminating the friction that prevents research from influencing decisions. When your entire research workflow lives in one platform, insights move faster from discovery to action.
What separates genuine all-in-one solutions from feature-heavy tools is thoughtful integration. The best platforms ensure that data flows seamlessly between methods, participants can be recruited consistently across study types, and insights build upon each other rather than existing in isolation. This integrated approach enables both quick validation studies and comprehensive strategic research within the same environment.
Optimal has carved out a unique position in the UX research landscape: it’s powerful enough for enterprise teams at Netflix, HSBC, Lego, and Toyota, yet intuitive enough that anyone, product managers, designers, even marketers, can confidently run usability studies. That balance between depth and accessibility is hard to achieve, and it's where Optimal shines.
Unlike fragmented tool stacks, Optimal is a complete User Insights Platform that supports the full research workflow. It covers everything from study design and participant recruitment to usability testing, prototype validation, AI-assisted interviews, and a research repository. You don't need multiple logins or wonder where your data lives, it's all in one place.
Two recent features push the platform even further:
One of Optimal's biggest advantages is its pricing model. There are no per-seat fees, no participant caps, and no limits on the number of users. Pricing is usage-based, so anyone on your team can run a study without needing a separate license or blowing your budget. It's a model built to support research at scale, not gate it behind permissioning.
Reviews on G2 reflect this balance between power and ease. Users consistently highlight Optimal's intuitive interface, responsive customer support, and fast turnaround from study to insight. Many reviewers also call out its AI-powered features, which help teams synthesize findings and communicate insights more effectively. These reviews reinforce Optimal's position as an all-in-one platform that supports research from everyday usability checks to strategic deep dives.
The bottom line? Optimal isn't just a suite of user research tools. It's a system that enables anyone in your organization to participate in user-centered decision-making, while giving researchers the advanced features they need to go deeper.
UserTesting built its reputation on one thing: remote usability testing with real-time video feedback. Watch people interact with your product, hear them think aloud, see where they get confused. It's immediate and visceral in a way that heat maps and analytics can't match.
The platform excels at both moderated and unmoderated usability testing, with strong user panel access that enables quick turnaround. Large teams particularly appreciate how fast they can gather sentiment data across UX research studies, marketing campaigns, and product launches. If you need authentic user reactions captured on video, UserTesting delivers consistently.
That said, reviews on G2 and Capterra note that while video feedback is excellent, teams often need to supplement UserTesting with additional tools for deeper analysis and insight management. The platform's strength is capturing reactions, though some users mention the analysis capabilities and data export features could be more robust for teams running comprehensive research programs.
A significant consideration: UserTesting operates on a high-cost model with per-user annual fees plus additional session-based charges. This pricing structure can create unpredictable costs that escalate as your research volume grows, teams often report budget surprises when conducting longer studies or more frequent research. For organizations scaling their research practice, transparent and predictable pricing becomes increasingly important.
Maze understands that speed matters. Design teams working in agile environments don't have weeks to wait for findings, they need answers now. The platform leans into this reality with rapid prototype testing and continuous discovery research, making it particularly appealing to individual designers and small product teams.
Its Figma integration is convenient for quick prototype tests. However, the platform's focus on speed involves trade-offs in flexibility as users note rigid question structures and limited test customization options compared to more comprehensive platforms. For straightforward usability tests, this works fine. For complex research requiring custom flows or advanced interactions, the constraints become more apparent.
User feedback suggests Maze excels at directional insights and quick design validation. However, researchers looking for deep qualitative analysis or longitudinal studies may find the platform limited. As one G2 reviewer noted, "perfect for quick design validation, less so for strategic research." The reporting tends toward surface-level metrics rather than the layered, strategic insights enterprise teams often need for major product decisions.
For teams scaling their research practice, some considerations emerge. Lower-tier plans limit the number of studies you can run per month, and full access to card sorting, tree testing, and advanced prototype testing requires higher-tier plans. For teams running continuous research or multiple studies weekly, these study caps and feature gates can become restrictive. Users also report prototype stability issues, particularly on mobile devices and with complex design systems, which can disrupt testing sessions. Originally built for individual designers, Maze works well for smaller teams but may lack the enterprise features, security protocols, and dedicated support that large organizations require for comprehensive research programs.
Dovetail has positioned itself as the research repository and analysis platform that helps teams make sense of their growing body of insights. Rather than conducting tests directly, Dovetail shines as a centralization hub where research from various sources can be tagged, analyzed, and shared across the organization. Its collaboration features ensure that insights don't get buried in individual files but become organizational knowledge.
Many teams use Dovetail alongside testing platforms like Optimal, creating a powerful combination where studies are conducted in dedicated research tools and then synthesized in Dovetail's collaborative environment. For organizations struggling with insight fragmentation or research accessibility, Dovetail offers a compelling solution to ensure research actually influences decisions.
Lookback specializes in moderated user interviews and remote testing, offering a clean, focused interface that stays out of the way of genuine human conversation. The platform is designed specifically for qualitative UX work, where the goal is deep understanding rather than statistical significance. Its streamlined approach to session recording and collaboration makes it easy for teams to conduct and share interview findings.
For researchers who prioritize depth over breadth and want a tool that facilitates genuine conversation without overwhelming complexity, Lookback delivers a refined experience. It's particularly popular among UX researchers who spend significant time in one-on-one sessions and value tools that respect the craft of qualitative inquiry.
Lyssna (formerly UsabilityHub) positions itself as a straightforward, budget-friendly option for teams needing quick feedback on designs. The platform emphasizes simplicity and fast turnaround, making it accessible for smaller teams or those just starting their research practice.
The interface is deliberately simple, which reduces the learning curve for new users. For basic preference tests, first-click tests, and simple prototype validation, Lyssna's streamlined approach gets you answers quickly without overwhelming complexity.
However, this simplicity involves significant trade-offs. The platform operates primarily as a self-service testing tool rather than a comprehensive research platform. Teams report that Lyssna lacks AI-powered analysis, you're working with raw data and manual interpretation rather than automated insight generation. The participant panel is notably smaller (around 530,000 participants) with limited geographic reach compared to enterprise platforms, and users mention quality control issues where participants don't consistently match requested criteria.
For organizations scaling beyond basic validation, the limitations become more apparent. There's no managed recruitment service for complex targeting needs, no enterprise security certifications, and limited support infrastructure. The reporting stays at a basic metrics level without the layered analysis or strategic insights that inform major product decisions. Lyssna works well for simple, low-stakes testing on limited budgets, but teams with strategic research needs, global requirements, or quality-critical studies typically require more robust capabilities.
The UX and user research industry is shifting in important ways:
Live environment usability testing is growing. Insights from real users on live sites are proving more reliable than artificial prototype studies. Optimal is leading this shift with dedicated Live Site Testing capabilities that capture authentic behavior where it matters most.
AI-powered research tools are finally delivering on their promise, speeding up analysis while preserving depth. The best implementations, like Optimal's Interviews, handle time-consuming synthesis without losing the nuanced context that makes qualitative research valuable.
Research democratization means UX research is no longer locked in specialist teams. Product managers, designers, and marketers are now empowered to run studies. This doesn't replace research expertise; it amplifies it by letting specialists focus on complex strategic questions while teams self-serve for straightforward validation.
Inclusive, global recruitment is now non-negotiable. Platforms that support accessibility testing and global participant diversity are gaining serious traction. Understanding users across geographies, abilities, and contexts has moved from nice-to-have to essential for building products that truly serve everyone.
Forget feature checklists. Instead, ask:
Do you need qualitative vs. quantitative UX research? Some platforms excel at one, while others like Optimal provide robust capabilities for both within a single workflow.
Will non-researchers be running studies (making ease of use critical)? If this is your goal, prioritize intuitive interfaces that don't require extensive training.
Do you need global user panels, compliance features, or AI-powered analysis? Consider whether your industry requires specific certifications or if AI-assisted synthesis would meaningfully accelerate your workflow.
How important is integration with Figma, Slack, Jira, or Notion? The best platform fits naturally into your existing stack, reducing friction and increasing adoption across teams.
When assessing comprehensive research platforms, look beyond the feature list to understand how well different capabilities work together. The best all-in-one solutions excel at data continuity, participants recruited for one study can seamlessly participate in follow-up research, and insights from usability tests can inform survey design or interview discussion guides.
Consider your team's research maturity and growth trajectory. Platforms like Optimal that combine ease of use with advanced capabilities allow teams to start simple and scale sophisticated research methods as their needs evolve, all within the same environment. This approach prevents the costly platform migrations that often occur when teams outgrow point solutions.
Pay particular attention to analysis and reporting integration. All-in-one platforms should synthesize findings across research methods, not just collect them. The ability to compare prototype testing results with interview insights, or track user sentiment across multiple touchpoints, transforms isolated data points into strategic intelligence.
Most importantly, the best platform is the one your team will actually use. Trial multiple options, involve stakeholders from different disciplines, and evaluate not just features but how well each tool fits your team's natural workflow.
Each of these platforms brings strengths. But Optimal stands out for a rare combination: end-to-end research capabilities, AI-powered insights, and usability testing at scale in an all-in-one interface designed for all teams, not just specialists.
With the additions of Live Site Testing capturing authentic user behavior in production environments, and Interviews delivering rapid qualitative synthesis, Optimal helps teams make faster, better product decisions. The platform removes the friction that typically prevents research from influencing decisions, whether you're running quick usability tests or comprehensive mixed-methods studies.
The right UX research platform doesn't just collect data. It ensures user insights shape every product decision your team makes, building experiences that genuinely serve the people using them. That's the transformation happening at the moment; Research is becoming central to how we build, not an afterthought.
