Subscribe to OW blog for an instantly better inbox
Oops! Something went wrong while submitting the form.

Our exciting new feature, segments, saves time by allowing you to create and save groups of participant responses based on various filters. Think of it as your magic wand to effortlessly organize and scrutinize the wealth of data and insight you collect in your studies. Even more exciting is that the segments are available in all our quantitative study tools, including Optimal Sort, Treejack, Chalkmark, and Questions.
In a nutshell, segments let you effortlessly create and save groups of participants' results based on various filters, saving you and the team time and ensuring you are all on the same page.
A segment represents a demographic within the participants who completed your study. These segments can then be applied to your study results, allowing you to easily view and analyze the results of that specific demographic and spot the hidden trends.
Put simply, you've got a treasure trove of participant data, and you need to be able to slice and dice it in various ways. Segmenting your data will help you dissect and explore your results for deeper and more accurate results.
Question responses: Using a screener survey or pre - or post-study questions with pre-set answers (like multi-choice), you can segment your results based on their responses.
URL tag: If you identify participants using a unique identifier such as a URL tag, you can select these to create segments.
Tree test tasks, card sort categories created, first click test and survey responses: Depending on your study type, you can create a segment to categorize participants based on their response in the study.
Time taken: You can select the time taken filter to view data from those who completed your study in a short space of time. This may highlight some time wasters who speed through and probably haven’t provided you with high-quality responses. On the other hand, it can provide insight into A/B tests for example, it could show you if it’s taking participants of a tree test longer to find a destination in one tree or another.
With this feature, you can save and apply multiple segments to your results, using a combination of AND/OR logic when creating conditions. This means you can get super granular insights from your participants and uncover those gems that might have otherwise remained hidden.
This feature is your go-to when you have results from two or more participant segments. For example, imagine you're running a study involving both teachers and students. You could focus on a segment that gave a specific answer to a particular task, question, or card sort. It allows you to drill down into the nitty-gritty of your data and gain more understanding of your customers.
Let's explore how you can harness the power of segments:
Save time: Create and save segments to ensure everyone on your team is on the same page. With segments, there's no room for costly data interpretation mishaps as everyone is singing from the same hymn book.
Surface hidden trends: Identifying hidden trends or patterns within your study is much easier. With segments, you can zoom in on specific demographics and make insightful, data-driven decisions with confidence.
Organized chaos: No more data overload! With segments, you can organize participant data into meaningful groups, unleashing clarity and efficiency.
Ready to take segments for a spin? To create a new segment or edit an existing one, go to Results > Participants > Segments. Select the ‘Create segment’ button and select the filters you want to use. You can add multiple conditions, and save the segment. To select a segment to apply to your results, click on ‘All included participants’ and select your segment from the drop-down menu. This option will apply to all your results in your study.

We can't wait to see the exciting discoveries you'll make with this powerful tool. Get segmenting, and let us know what you think!

We’re excited to share some new features and product updates that we've rolled out lately and what’s coming up next.
Customer feedback and research have shown that users analyse results in Treejack in a task-by-task manner. To better support this way of working, we’ve updated Treejack results to ensure the success and directness of each task are easier to compare with the new Task overview tab in Results. This new visualisation is available in Results > Overview> Task overview section in Optimal Workshop.

We have also introduced the aggregate paths view in the Paths tab (it used to only be visible via the compare tasks button). This allows users to more easily see what the popular paths are for each task and how much each successful path was used (or not).
Over the next few months, we’ll continue working through our results tabs to update them to a task-by-task view and highlight insights at a task level.
We’re continuing work to improve the quality of participants recruited in Optimal Workshop. Our latest release involves eliminating all participants that rush through a Treejack study. We’ve analysed years of participants to get a good idea of what ‘rushing’ means, and we can now identify these ‘speeders’ and remove them from our participant pools. We have also removed the limit in-app for replacement participants across all study types, and released updates to immediately eliminate poor quality participants from custom orders.
Help guide: How to replace study participants in-app
We are excited to announce our first six project templates are now available. Templates have been created with industry experts to give you the confidence to quickly launch studies and back your results to make data-driven decisions. These ready-made templates give you a headstart on your research by providing you with the right range of study types and when to use them.
Templates are accessible in the app from the Dashboard > Browse Templates. From the ‘templates menu’ select a template that matches your use case for example ‘I need to organise content into categories’ and get going faster than before. You can edit and customise the templates to suit your research goals.
This is just the beginning of our template journey and while we continue to build up our collection we’d love your input too. If there are templates that you regularly use and think the community could benefit from we’d love to hear from you. Email us at product@optimalworkshop.com.
The Optimal Academy is due to launch in later this month. The Academy will provide education that enables our customers to get started faster with our tools and elevate their knowledge of all things Information Architecture and UX.
The first courses available will be a series of Optimal Workshop tool-based lessons, including best practice study setup analysis and recruitment. You can expect to see more exclusive content and courses from industry experts and institutions on a diverse range of topics continuing to drop in 2023 and 2024.
We’re committed to making things easier for our team customers, particularly on the administration side of our product. Our product team have begun discovery on improving our administration features, and have had a lot of great customer feedback to help shape up the opportunities. We are aiming to make improvements to this area of the product later this year.

If you missed our live training, don’t worry, we’ve got you covered! In this session, our product experts Katie and Aidan discuss why, how and when to benchmark an existing structure using Treejack.
They also talk through some benchmarking use cases, demo how to compare tasks between different studies, and which results are most helpful.

We all know that building a robust information architecture (IA) can make or break your product. And getting it right can rely on robust user research. Especially when it comes to creating human-centered, intuitive products that deliver outstanding user experiences.
But what are the best methods to test your information architecture? To make sure that your focus is on building an information architecture that is truly based on what your users want, and need.
With all the will in the world, your product (or website or mobile app) may work perfectly and be as intuitive as possible. But, if it is only built on information from your internal organizational perspective, it may not measure up in the eyes of your user. Often, organizations make major design decisions without fully considering their users. User research (UX) backs up decisions with data, helping to make sure that design decisions are strategic decisions.
Testing your information architecture can also help establish the structure for a better product from the ground up. And ultimately, the performance of your product. User experience research focuses your design on understanding your user expectations, behaviors, needs, and motivations. It is an essential part of creating, building, and maintaining great products.
Taking the time to understand your users through research can be incredibly rewarding with the insights and data-backed information that can alter your product for the better. But what are the key user research methods for your information architecture? Let’s take a look.
There is more than one way to test your IA. And testing with one method is good, but with more than one is even better. And, of course, the more often you test, especially when there are major additions or changes, you can tweak and update your IA to improve and delight your user’s experience.
Card sorting is a user research method that allows you to discover how users understand and categorize information. It’s particularly useful when you are starting the planning process of your information architecture or at any stage you notice issues or are making changes. Putting the power into your users’ hands and asking how they would intuitively sort the information. In a card sort, participants sort cards containing different items into labeled groups. You can use the results of a card sort to figure out how to group and label the information in a way that makes the most sense to your audience.
There are a number of techniques and methods that can be applied to a card sort. Take a look here if you’d like to know more.
Card sorting has many applications. It’s as useful for figuring out how content should be grouped on a website or in an app as it is for figuring out how to arrange the items in a retail store.You can also run a card sort in person, using physical cards, or remotely with online tools such as OptimalSort.
Taking a look at your information architecture from the other side can also be valuable. Tree testing is a usability method for evaluating the findability of topics on a product. Testing is done on a simplified text version of your site structure without the influence of navigation aids and visual design.
Tree testing tells you how easily people can find information on your product and exactly where people get lost. Your users rely on your information architecture – how you label and organize your content – to get things done.
Tree testing can answer questions like:
Treejack is our tree testing tool and is designed to make it easy to test your information architecture. Running a tree test isn’t actually that difficult, especially if you’re using the right tool. You’ll learn how to set useful objectives, how to build your tree, write your tasks, recruit participants, and measure results.
If you are wanting a fully rounded view of your information architecture, it can be useful to combine your research methods.
Tree testing and card sorting, along with usability testing, can give you insights into your users and audience. How do they think? How do they find their way through your product? And how do they want to see things labeled, organized, and sorted?
If you want to get fully into the comparison of tree testing and card sorting, take a look at our article here, which compares the options and explains which is best and when.
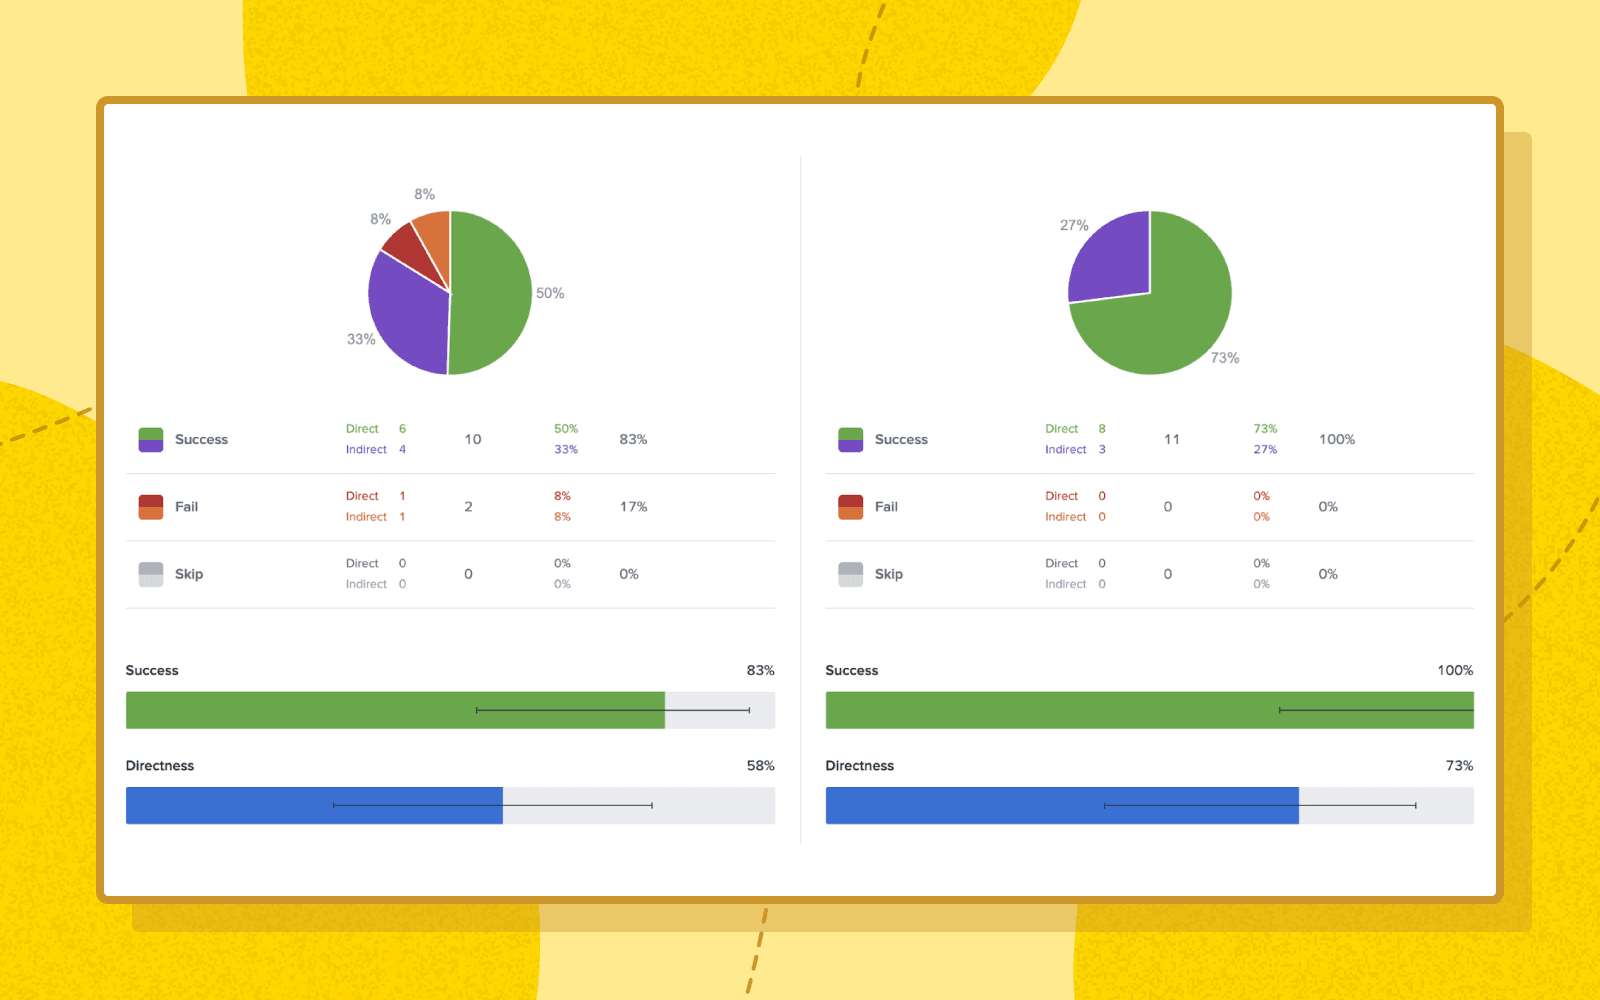
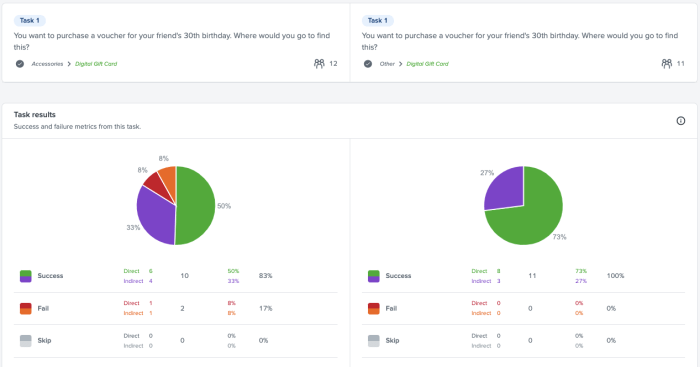
Testing and comparing multiple variations of trees will help you nail down an effective navigation structure before you implement it, saving time and costly mistakes. Treejack's comparison feature allows you to compare two tasks from two different Treejack studies without leaving the results page. It helps make comparing your variations easier and faster by putting results side-by-side for you to explore simultaneously.
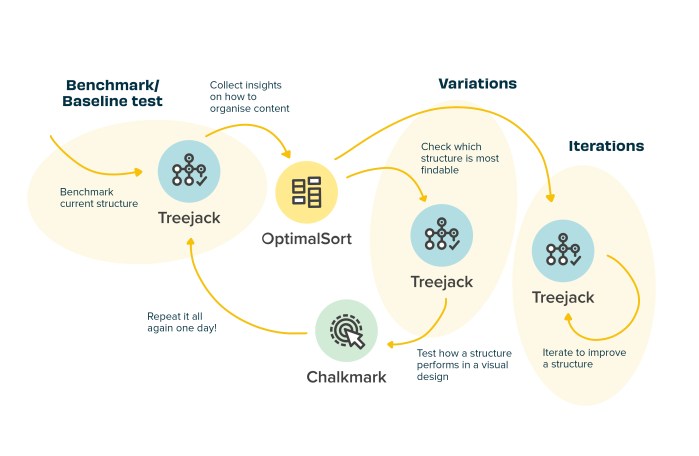
The image above shows a common workflow of how Optimal Workshop tools can be used together to improve your navigation structure.
First things first, sign into your Optimal Workshop account.
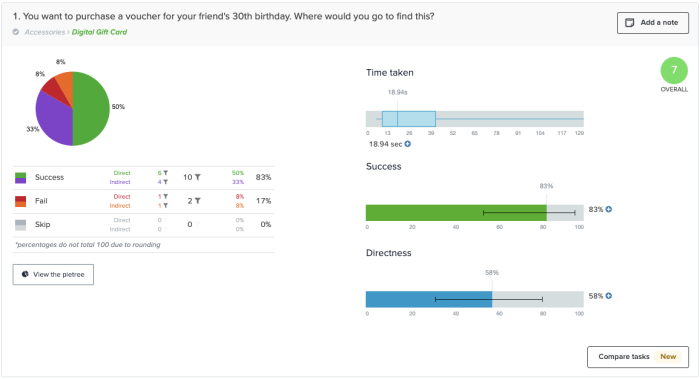
Open the tree test that you want to start your comparison from, then navigate to the Task Results tab in the Analysis section.
Click the ‘compare tasks’ button in your chosen task.
Next select the study and task you want to compare then click 'Compare tasks'.
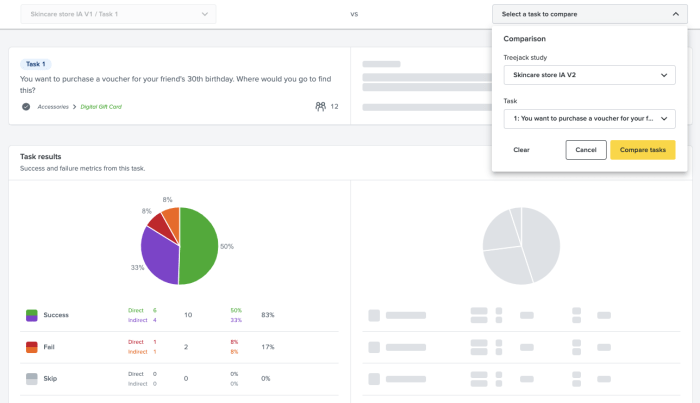
You can now compare the two tasks together and start the analysis process. Do this as many times, with as many tests and tasks, as you need to.
We’ve got a lot of exciting improvements in the pipeline and as always, we’d love your feedback. You can make feature requests, vote on existing requests and send feedback in Optimal Workshop using the Resource Centre. It's located at the bottom right hand corner of your account, just click the ? icon.
Log in now let us know what you think!
A great information architecture (IA) is essential for a great user experience (UX). And testing your website or app’s information architecture is necessary to get it right.
Card sorting and tree testing are the very best UX research methods for exactly this. But the big question is always: which one should you use, and when? Very possibly you need both. Let’s find out with this quick summary.
Card sorting is used to test the information architecture of a website or app. Participants group individual labels (cards) into different categories according to criteria that makes best sense to them. Each label represents an item that needs to be categorized. The results provide deep insights to guide decisions needed to create an intuitive navigation, comprehensive labeling and content that is organized in a user-friendly way.
Tree testing is also used to test the information architecture of a website or app. When using tree testing participants are presented with a site structure and a set of tasks they need to complete. The goal for participants is to find their way through the site and complete their task. The test shows whether the structure of your website corresponds to what users expect and how easily (or not) they can navigate and complete their tasks.
Card sorting is a UX research method which helps to gather insights about your content categorization. It focuses on creating an information architecture that responds intuitively to the users’ expectations. Things like which items go best together, the best options for labeling, what categories users expect to find on each menu.
Doing a simple card sort can give you all those pieces of information and so much more. You start understanding your user’s thoughts and expectations. Gathering enough insights and information to enable you to develop several information architecture options.
Tree testing is a UX research method that is almost a card sort in reverse. Tree testing is used to evaluate an information architecture structure and simply allows you to see what works and what doesn’t.
Using tree testing will provide insights around whether your information architecture is intuitive to navigate, the labels easy to follow and ultimately if your items are categorized in a place that makes sense. Conversely it will also show where your users get lost and how.
You’ve got this far and fine-tuning your information architecture should be a priority. An intuitive IA is an integral component of a user-friendly product. Creating a product that is usable and an experience users will come back for.
If you are still wondering which method you should use - tree testing or card sorting. The answer is pretty simple - use both.
Just like many great things, these methods work best together. They complement each other, allowing you to get much deeper insights and a rounded view of how your IA performs and where to make improvements than when used separately. We cover more reasons why card sorting loves tree testing in our article which dives deeper into why to use both.
Wanting full, rounded insights into your information architecture is great. And we know that tree testing and card sorting work well together. But is there an order you should do the testing in? It really depends on the particular context of your research - what you’re trying to achieve and your situation.
Tree testing is a great tool to use when you have a product that is already up and running. By running a tree test first you can quickly establish where there may be issues, or snags. Places where users get caught and need help. From there you can try and solve potential issues by moving on to a card sort.
Card sorting is a super useful method that can be instigated at any stage of the design process, from planning to development and beyond. As long as there is an IA structure that can be tested again. Testing against an already existing website navigation can be informative. Or testing a reorganization of items (new or existing) can ensure the organization can align with what users expect.
However, when you decide to implement both of the methods in your research, where possible, tree testing should come before card sorting. If you want a little more on the issue have a read of our article here.
Check out our OptimalSort and Treejack tools - we can help you with your research and the best way forward. Wherever you might be in the process.
