Subscribe to OW blog for an instantly better inbox
Oops! Something went wrong while submitting the form.

Mobile app testing with users before, during and beyond the design process is essential to ensuring product success. As UX designers we know how important usability is for interaction design, but testing early and often on mobile can sometimes be a challenge. This is where usability testing tools like Chalkmark (our first-click testing tool) can make a big difference.
First-click testing on mobile apps allows you to rapidly test ideas and ensure your design supports user goals before you invest time and money in further design work and development. It helps you determine whether you’re on the right track and whether your users are too — people are 2 to 3 times as likely to successfully complete their task if they got their first click right.
Read on for our top tips for mobile testing with Chalkmark shared through an example of a study we recently ran on Airbnb and TripAdvisor’s mobile apps.
There’s 2 ways that you might approach mobile app testing with Chalkmark: remotely or in person. Chalkmark is great for remote testing because it allows you to gain insights quickly as well as reach people anywhere in the world as the study is simply shared via a link. You might recruit participants via your social networks or email lists or you could use a recruitment service to target specific groups of people. The tool is also flexible enough to work just as well for moderated and in-person research studies. You might pop your study onto a mobile device and hit the streets for some guerrilla testing or you might incorporate it into a usability testing session that you’ve already got planned. There’s no right or wrong way to do it — it really depends on the needs of your project and the resources you have available.
For our Airbnb and TripAdvisor mobile app study example, we decided to test remotely and recruited 30 US based participants through the Optimal Workshop recruitment service.
Chalkmark works by presenting participants with a real-world scenario based task and asking them to complete it simply by clicking on a static image of a design. That image could be anything from a rough sketch of an idea, to a wireframe, to a screenshot of your existing product. Anything that you would like to gather your user’s first impressions on — if you can create an image of it, you can Chalkmark it.
To build your study, all you have to do is upload your testing images and come up with some tasks for your participants to complete. Think about the most common tasks a user would need to complete while using your app and base your mobile testing tasks around those. For our Airbnb and TripAdvisor study, we decided to use 3 tasks for each app and tested both mobile apps together in one study to save time. Task order was randomized to reduce bias and we used screenshots from the live apps for testing.
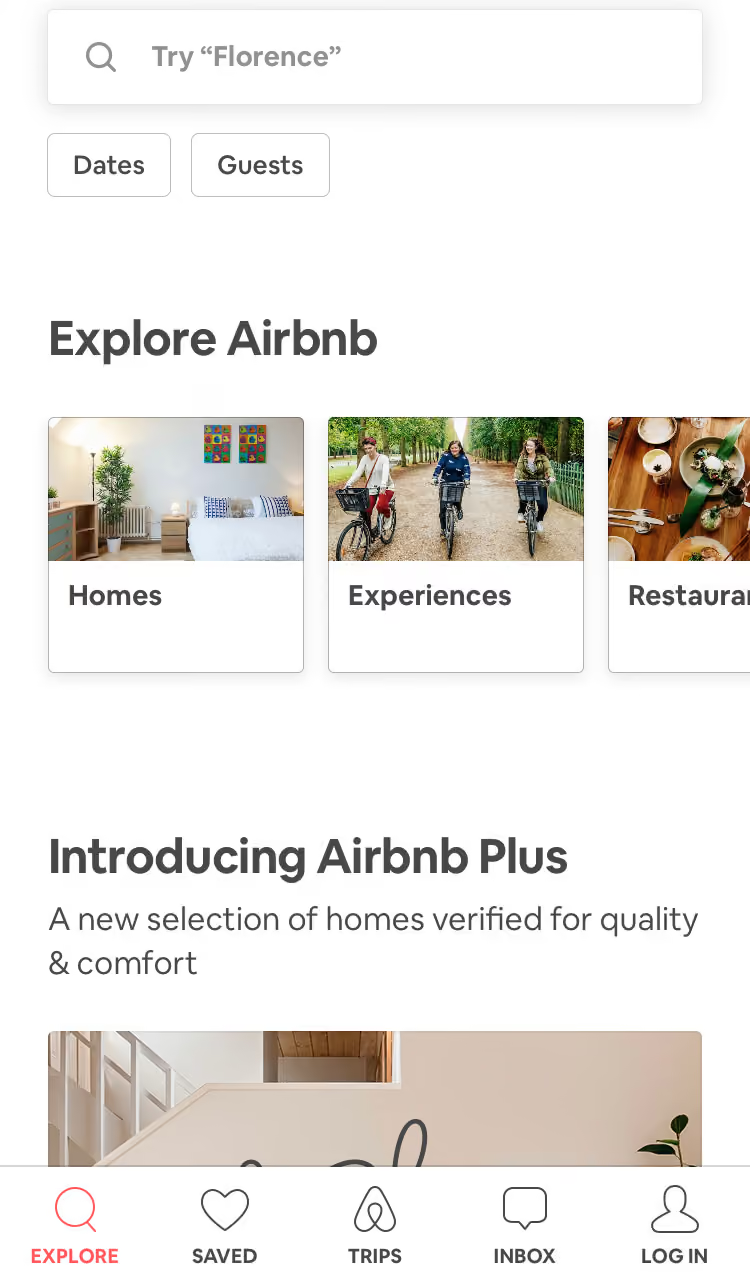
For Airbnb, we focused our mobile testing efforts on the three main areas of their service offering: Homes, Experiences and Restaurants. We wanted to see if people understood the images and labels used and also if there were any potential issues with the way Airbnb presents these three options as horizontally scrollable tiles where the third one is only partially shown in that initial glance.
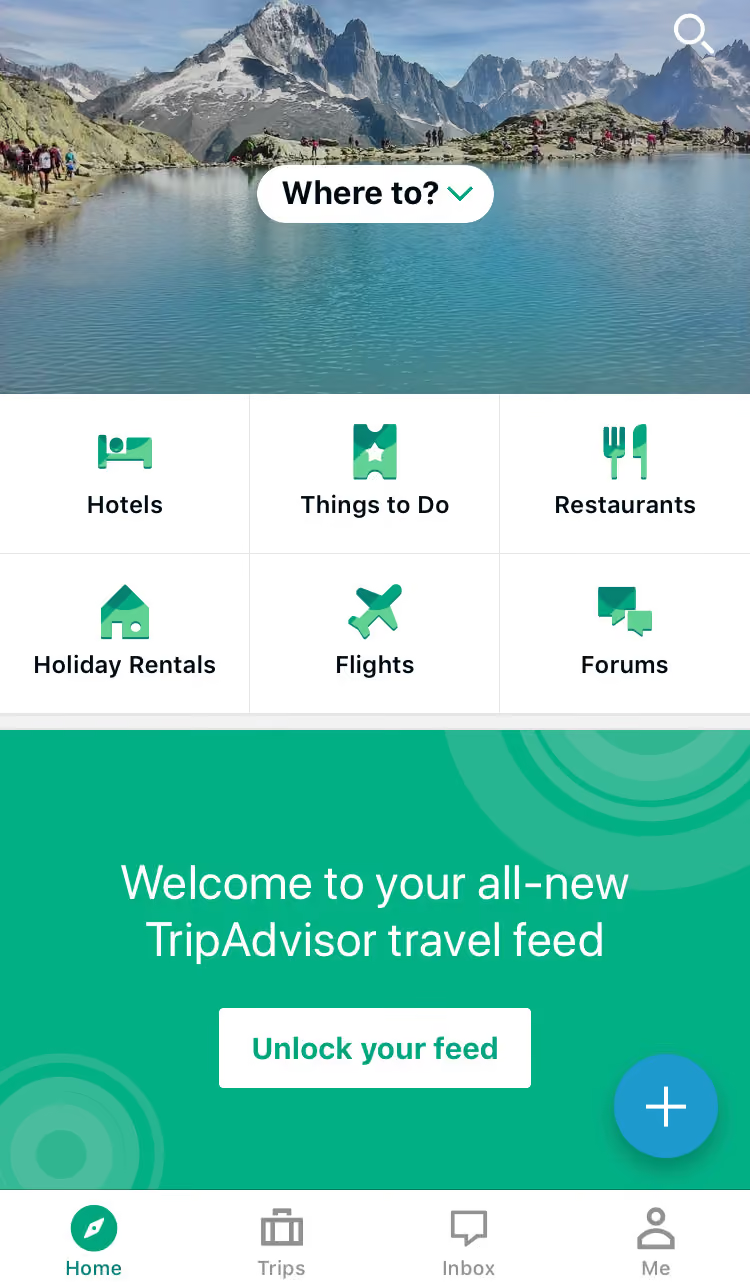
For TripAdvisor, we were curious to see if the image-only icons on the sticky global navigation menu that appears when the page is scrolled made sense to users. We chose three of these icons to test: Holiday Rentals, Things To Do and Forums.
Our Chalkmark study had a total of 6 tasks — 3 for each app — and we tested both mobile apps together to save time.
Our tasks for this study were:
1. You’ll be spending the holidays with your family in Montreal this year and a friend has recommended you book yourself into an axe throwing workshop during your trip.
2. Where would you go to do this? (Airbnb)
3. You’ve heard that Airbnb has a premium range of places to stay that have been checked by their team to ensure they’re amazing. Where would you go to find out more? (Airbnb)
4. You’re staying with your parents in New York for the week and would like to surprise them by taking them out to dinner but you’re not sure where to take them. Where would you go to look for inspiration? (Airbnb)
5. You’re heading to New Zealand next month and have so many questions about what it’s like! You’d love to ask the online community of locals and other travellers about their experiences. Where would you go to do this? (TripAdvisor)
6. You’re planning a trip to France and would prefer to enjoy Paris from a privately owned apartment instead of a hotel. Where would you go to find out what your options are? (TripAdvisor)
7. You’re currently on a working holiday in Melbourne and you find yourself with an unexpected day off. You’re looking for ideas for things to do. Where would you go to find something like this? (TripAdvisor)
Task order was randomized to reduce bias and we used screenshots from the live apps for testing.All images used for testing were the size of a single phone screen because we wanted to see if they could find their way without needing to scroll. As with everything else, you don’t have to do it this way — you could make the image longer and test a larger section of your design or you could focus on a smaller section. As a testing tool, Chalkmark is flexible and scalable.
We also put a quickly mocked up frame around each image that loosely resembled a smart phone because without it, the image looked like part of it had been cropped out which could have been very distracting for participants! This frame also provided context that we were testing a mobile app.
Chalkmark makes it really easy to make sense of your research through clickmaps and some really handy task results data. These 2 powerful analysis features provide a well-rounded and easy to digest picture of where those valuable first clicks landed so that you can evolve your design quickly and confidently.
A clickmap is a visualization of where your participants clicked on your testing image during the study. It has different views showing heatmaps and actual click locations so you can see exactly where they fell. Clickmaps help you to understand if your participants were on the right track or, if they weren’t, where they went instead.The task results tab in Chalkmark shows how successful your participants were and how long it took them to complete the task. To utilize the task results functionality, all you have to do is set the correct clickable areas on the images you tested with — just click and drag and give each correct area a meaningful name that will then appear alongside the rest of the task results. You can do this during the build process or anytime after the study has been completed. This is very useful if you happen to forget something or are waiting on someone else to get back to you while you set up the test!
For our Airbnb and TripAdvisor study, we set the correct areas on the navigational elements (the tiles, the icons etc) and excluded search. While searching for something isn’t necessarily incorrect, we wanted to see if people could find their way by navigating. For Airbnb, we discovered that 83% of our participants were able to correctly identify where they would need to go to book themselves into an axe throwing workshop. With a median task completion time of 4.89 seconds, this task also had the quickest completion time in the entire study. These findings show that the label and image being used for the ‘Experiences’ section of the app appears to be working quite well.
We also found that 80% of participants were able to find where they’d need to go to access Airbnb Plus. Participants had two options and could go via the ‘Homes’ tile (33%) or through the ‘Introducing Airbnb Plus’ image (47%) further down. Of the remaining participants, 10% clicked on the ‘Introducing Airbnb Plus’ heading, however at the time of testing, this area was not clickable. It’s not a huge deal because these participants were on the right track and would have likely found the right spot to click fairly quickly anyway. It’s just something to consider around user expectations and perhaps making that heading clickable might be worth exploring further.
83% of our participants were able to figure out where to go to find a great restaurant on the Airbnb app which is awesome! An additional 7% would have searched for it which isn’t wrong, but remember, we were testing those navigational tiles. It’s interesting to note that most people selected the tiles — likely indicating they felt they were given enough information to complete the task without needing to search.
For our TripAdvisor tasks, we uncovered some very interesting and actionable insights. We found that 63% of participants were able to correctly identify the ‘Forums’ icon as the place to go for advice from other community members. While 63% is a good result, it does indicate some room for improvement and the possibility that the ‘Forums’ icon might not be reasonating with users as well as it could be. For the remaining participants, 10% clicked on ‘Where to?’ which prompts the user to search for specific locations while 7% clicked on the more general search option that would allow them to search all the content on the app.
63% of participants were able to correctly identify the ‘Holiday Rentals’ icon on the TripAdvisor app when looking for a privately owned apartment rather than a hotel to enjoy Paris from, while 20% of participants appear to have been tripped up by the ‘Hotel’ icon itself.
With 1 in 5 people in this study potentially not being able to distinguish between or determine the meaning behind each of the 2 icons, this is something that might merit further exploration. In another one of the TripAdvisor app’s tasks in this study, 43% of participants were unable to correctly identify the ‘Things To Do’ icon as a place to find inspiration for activities.Where to from here?
If this were your project, you might look at running a quick study to see what people think each of the 6 icons represent. You could slip it into some existing moderated research you had planned or you might run a quick image card sort to see what your users would expect each icon to relate to. Running a study testing all 6 at the same time would allow you to gain insights into how users perceive the icons quickly and efficiently.
Overall, both of these apps tested very well in this study and with a few minor tweaks and iterations that are part of any design process, they could be even better!
Now that you’ve seen an example of mobile testing in Chalkmark, why not try it out for yourself with your app? It’s fast and easy to run and we have lots of great resources to help you on your way including sample studies that allow you to interactively explore both the participant’s and the researcher’s perspective.
Further readingCreate and analyze a first-click test for freeView a first-click test as a participantView first-click test results as a researcherRead our first-click testing 101 guideRead more case studies and research stories to see first-click testing in action
Originally published on 29 March 2019
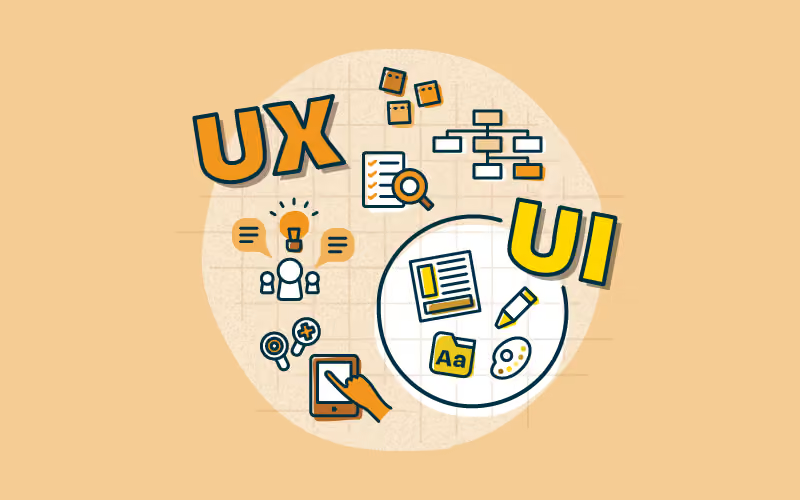
UI and UX are two terms that are often used interchangeably and confused for one another, but what do they actually mean? And is there a crossover between them?
These two terms have only grown in use in recent years, thanks largely to the exploding technology sector. This is great news. For organizations, effectively harnessing UX and UI enables them to build products and services that people will actually want to use – and continue using. For users, they’ll have access to products designed for them.
User experience (UX as it’s commonly called) refers to the experience that a person has with a product or service.
We can determine whether a user experience is good or bad based on how easy (or difficult) it is for users to interact with the various elements of a product or service. Is the sign-up flow easy to use? Does the CTA button on the homepage encourage users to click? UX design exists to answer questions like these – and here’s how.
At the core of UX design is user research, which you can use to understand customer pain points and actually build products designed for the people using them. Typically, user research involves the use of a number of different research methods designed to answer specific questions. Card sorting, for example, can show you how people think the information on your website should be arranged.
Designer and information architect Peter Morville came up with the user experience honeycomb, which demonstrates the various components of UX design.
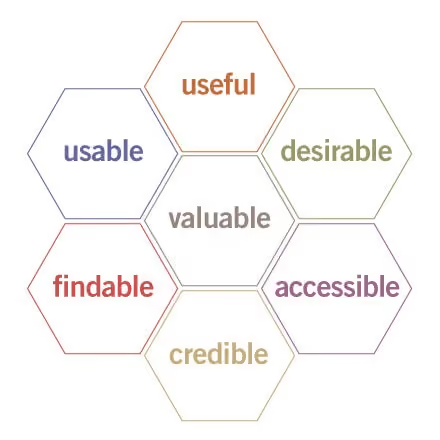
Don Norman of Nielsen Norman Group defines UX as “[encompassing] all aspects of the end-users interaction with the company, its services, and its products”.
If this seems broad, that’s because it is. UX actually extends beyond just the digital products of an organization and can be used for areas like retail, customer service and more. In fact, there’s actually a growing movement to replace UX with customer experience (CX), as a way of encompassing all of these disparate elements.
User interface (UI), in the most stripped-back definition, is the interface by which a user and a computer system communicate with one another. This includes the touchscreen on your smartphone, the screen on your laptop, your mouse and keyboard and countless other mechanisms.
With this in mind, user interface design is focused on the elements that users will see on these interfaces, such as buttons, text and images. UI design is all about layout, look and feel. The objective of UI design is to visually guide users through an interface so they can complete their task. In a nutshell, you don’t want a user to think too hard about what they’re doing.
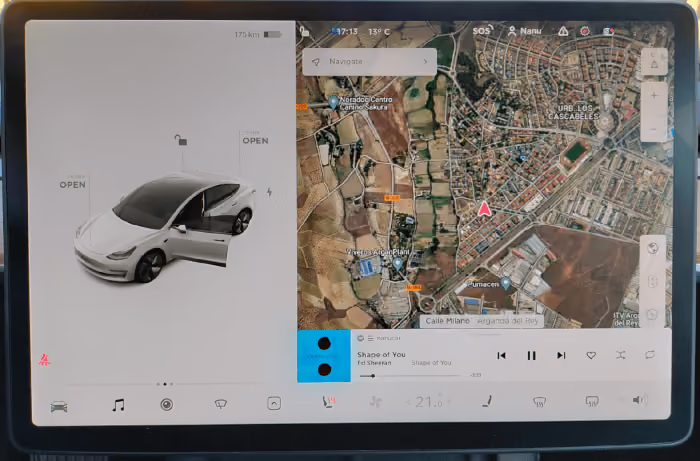
UI has its origins in the 1980s, when Xerox developed the very first graphical user interface (GUI). Instead of needing to interact with a computer through a programming language, people could now use icons, menus and buttons. The rest, as they say, is history. Apple came along with the Macintosh computer in 1984 (bringing with it the first point and click mouse), and now we’re all carrying smartphones with touch screens that even a baby can operate.
Like UX, UI has grown significantly – going far beyond what you’ll see on a computer screen. Those involved in the field of UI design today will work as much on the interfaces of computer programs and apps as they will on the user interfaces of cars, wearable devices and technologies in the home. If current trends continue, UI design is likely to become an even bigger field in the years ahead.
UX and UI are both essential components of a product or service. You can’t have one without the other, and, as we’ve explored, neglecting one could have serious consequences for your product’s success.
The difference between UX and UI is that UX is focused on the experience of using something and UI is focused on the look and feel of the interface.
“User Experience (UX) and User Interface (UI) are some of the most confused and misused terms in our field. A UI without UX is like a painter slapping paint onto a canvas without thought; while UX without UI is like the frame of a sculpture with no paper mache on it. A great product experience starts with UX followed by UI. Both are essential for the product’s success”. - Rahul Varshney, co-creator of Foster.fm
The difference between UX and UI is that UX is focused on the experience of using something and UI is focused on the look and feel of the interface.
Or, if you’d prefer a statement from venerable Nielsen Norman Group: “It’s important to distinguish the total user experience from the UI, even though the UI is obviously an extremely important part of the design. As an example, consider a website with movie reviews. Even if the UI for finding a film is perfect, the UX will be poor for a user who wants information about a small independent release if the underlying database only contains movies from the major studios”.
With this in mind, let’s now take a look at the people behind UX and UI. What do the roles look like in these fields? And, more importantly, what do they involve?
UX and UI as terms are only going to continue to grow, especially as technology and technology companies continue to proliferate across the globe. If you want to make sure that the user experience and user interfaces of your product or service are fit for the people using them, there’s no better place to start than with user research using powerful tools.

As humans, we have a unique talent: our brains are built to spot patterns and fill in the blanks. It’s why we see shapes in clouds, faces in everyday objects, and structure in random visual noise. This ability to combine individual elements into a meaningful whole underpins the Gestalt principles of visual perception, a cornerstone concept in psychology and design.
For UX designers, user researchers, and web teams, understanding these principles is essential. They reveal how people naturally group information, interpret visual relationships, and navigate interfaces. With a clearer view of how users perceive and process what they see, you can design more intuitive, human-centered experiences that support better decision-making and reduce friction across your product.
All the way back in the 1920s, a group of German psychologists (Wolfgang Köhler, Max Wertheimer and Kurt Koffka) wanted to better understand how humans perceive the world around them. They were interested in learning more about how the human brain makes sense of chaos.
These “gestalt psychologists” found that humans tend to group different elements together, identify patterns and find order in disorder. Interestingly, the psychologists found that humans don’t do this randomly – there are a number of principles that our brains use.
At the time, the growing field of design began to use the gestalt psychology principles in order to create designs that are more than the sum of their parts. The hidden arrow between the E and the X in the FedEx logo is just one example of this.

What happens when someone first sees the logo of your organization? How do they experience seeing the design for the first time? Gestalt psychology has a powerful role to play in how we perceive objects. If you want to create products and services that resonate with the people you intend to serve, understanding the gestalt principles is a good place to start – and it’s not that difficult.
With a solid understanding of these principles, you’ll be able to better direct people to what you want them to see, know which elements to use and when, and build better human experiences.
Here are the gestalt pricinples that we’ll be covering:
Principle: The gestalt principle of similarity states that when things appear to share some visual characteristics, they are assumed to be related in some way and we group them. These things don’t need to be identical, they just need to share a visible trait such as shape, size or color.
Look down from a high-rise building at a parking lot and you’ll immediately start grouping cars that are the same color. This is the principle of similarity and it’s a useful tool for UX designers.
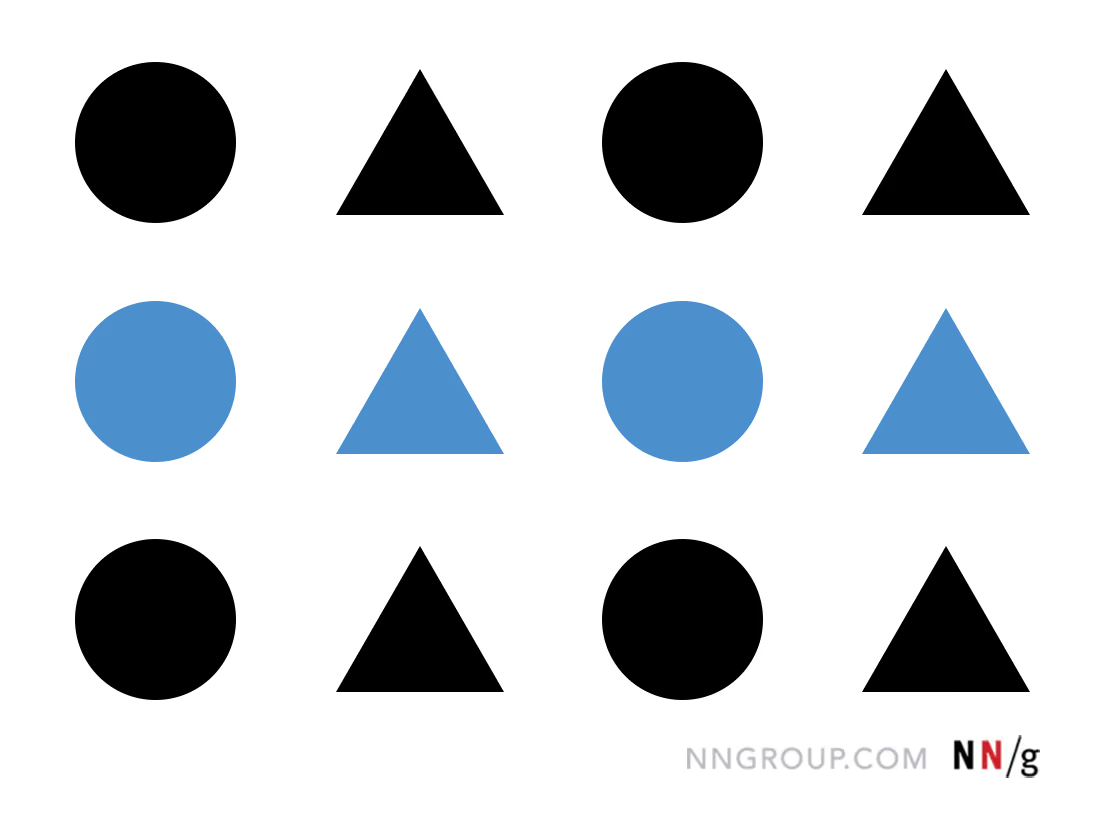
How to use this principle: You can use color in your products and services to indicate items with common functionality, for example in CTA buttons or links. On the other hand, you can use shape to indicate grouping.
Principle: Our brains instinctively distinguish between objects in the foreground and objects in the background.
Usually, we will interpret the larger area of an image as the background and the smaller part of the image as the foreground. Whenever someone first opens your mobile app or lands on your website, the figure/ground gestalt principle shows them what they should be focusing on.

How to use this principle: Use figure/ground to guide users to what you want them to see. This is particularly useful when you have something active that you need them to take action on, for example, a sign-up form or a search bar. In the case of the sign-up form, having the rest of the screen fade into the background can show users that the form is currently what they should be focusing on.
Principle: Things close together appear to be more related than things that are further apart.
The gestalt principle of proximity is one of the most powerful tools at your disposal, and can easily override other factors like color and shape. Mechanisms of perception (like proximity) compete with one another, and it’s important to understand which mechanisms you can use to accomplish your goals.

How to use this principle: You can use the gestalt law of proximity to get your users to identify the organization or structure that you want them to see without using borders. A good example of this would be grouping items on an online shopping website.
Principle: When we look at a complex arrangement of individual elements, we first try and identify a single, recognizable pattern.
The law of closure allows us to look at an image with missing parts, fill in the gaps and recognize the complete image so we can understand the pattern. This law is commonly used in logo design, where our brains fill in the gaps to understand the complete image.

How to use this principle: You can use closure to create delight (as in the example above), but it’s important to recognize that closure can also be used to mislead and to harm. As Andy Rutledge explains, even when closure works, it could be telling you a lie. It’s your job as a UXer to be aware of this.
Principle: When objects are located within the same closed region, we perceive them as being grouped together.
Common region is closely related to proximity and is an excellent tool for separating groups of objects, even if they’re close in proximity, size, color or shape.

How to use this principle: Use visible borders or barriers in your designs to create a sense of separation between different groups of objects.
Principle: Our brains tend to group together objects that are symmetrical with each other.
In German, the law of symmetry and order is known as prägnanz, which translates to “good figure”.

How to use this principle: Your designs should be balanced and complete, or you risk having users spend time trying to perceive a larger overall picture.
Principle: What stands out visually will capture a user’s attention first.
Focal points are areas of interest or difference within a composition. You can create a focal point by giving it more weight than other elements.
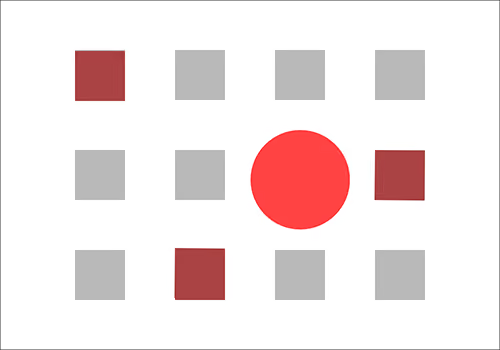
How to use this principle: Consider the focal point principle when you need to draw a user’s attention to an element on your page. For example, a call to action button or a sign-up button.
Principle: Elements arranged on a line or curve are perceived as more related than elements not on the same line or curve.
Once our eye begins to follow something, it will continue in that direction until it encounters another element. A good example of the continuity principle is a line with an arrow at the end. It indicates that we should follow the line to see where the arrow is pointing.
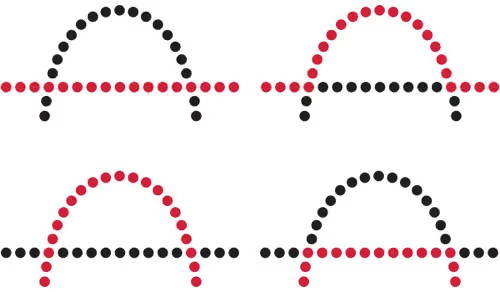
The continuity principle isn’t all about physical attributes such as lines and arrows. Continuity can also come from the logical groupings of items, for example in a field. When collecting information about a user’s location, for example, all geographical information should be arranged together.
How to use this principle: Consider the continuity principle both in terms of physical attributes and logical attributes – especially when designing forms.
Principle: We perceive elements moving in the same direction as more related than elements that are moving in different directions or stationary.
We use the principle of common fate every day of our lives. In fact, we as humans are wired to recognize contrasting movement over any other visual cue, whether it’s color, size, contrast or tone. Consider driving down the highway. The cars moving in the same direction as you are background noise, but when a car enters your lane from a side street you tend to immediately notice and respond.
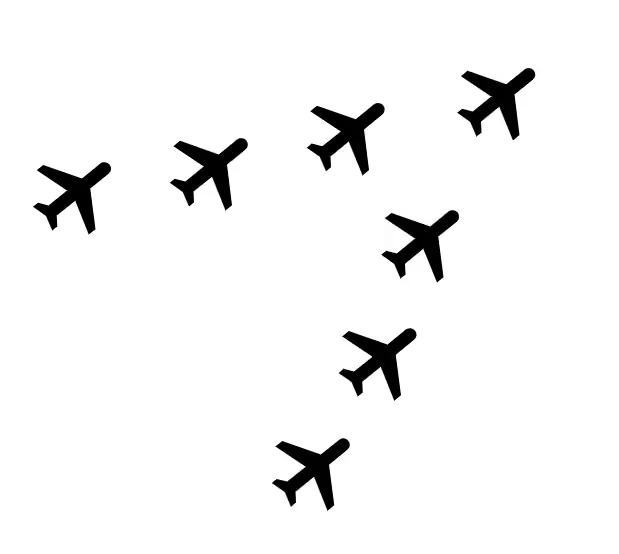
How to use this principle: This principle is key in motion design, with functional animation using common fate to guide our eye.
Building a solid understanding of the Gestalt principles helps you design clearer, more intuitive experiences. Whether you're creating a new website or refining a mobile sign-up flow, applying these principles can be the difference between a design that guides users naturally and one that misleads. With Optimal's user research and insights platform, you can validate whether your layouts and interactions actually support the perceptual patterns users rely on.
Few methods surpass card sorting when you need to figure out how your users understand and categorize information.
Whether you’re working on a new website, mobile app, intranet or even a physical store, this user research method is a powerful way of getting into the minds of the people you’re trying to serve.
For those of you unfamiliar with this method or just needing a recap, a card sort involves participants sorting cards containing different items into groups. It’s as simple as that. You can use the results to then determine how to group and label the information on your app or website in a way that makes sense to the people using it.
Imagine for a moment that you’re the owner of a small fitness apparel store called FitSmart, and you’ve just ordered in a shipment of new fitness trackers. You need to add these new products to your website, but you’re not exactly sure how they fit in alongside the shoes, clothing, equipment and supplements that you also offer.
This is where card sorting comes into play.
With this user research method, you can quickly determine where people might expect to find a fitness tracker category on your website. The card sort will present the test participants with a list of cards containing the names of items found on your website, and ask users to sort the cards into groups that make sense to them.
Remember: You are not your user, and while it is possible to take an educated guess as to where to position these products, using a card sort will take out the guesswork.
One of the other benefits of card sorting is that you can routinely come back to the method whenever you need to update your website.
Running a card sort is quite straightforward – and much simpler when using an online, unmoderated tool. Yes, you can run a card sort in person using paper cards, but you’ll then also have to coordinate with participants to have them meet you in a physical location, actually host each card sort and carry out all of the analysis manually.
Using an online tool like OptimalSort eliminates all of the admin and instead allows you to get on with the task of actually analyzing your results and making effective decisions. If you’d like to try card sorting, you can give OptimalSort a go for free and then follow this guide to set up your first test. We’d love to hear how you get on!
When you’re working in the realm of information architecture – whether that’s reorganizing the way your website is laid out or trying to arrange categories in a mobile shopping app – card sorting isn’t the be-all and end-all.
Card sorting can show you which things should go together, but you also need to be able to work out how people make their way through a website structure. This is where a method called tree testing comes into play.
Also known as reverse card sorting, you can use a tree test to evaluate the findability of different items. In a tree test, you task participants with completing a certain action (like finding fitness trackers) and observe them as they navigate through a text-only version of your website structure. By recording every step that they take, including any wrong turns and how long it takes them to complete the task, you can make more informed changes to the specific placement of different pages and elements.
It’s best to use card sorting and tree testing together.
Card sorting is one of the most effective ways of building products and services that are intuitive for the people using them. If you’re interested in learning more about this research method, check out the hub page for card sorting on the Optimal Workshop Blog.
Picture this scenario: You're in your local coffee shop and hear a new song. You want to listen to it when you get back to the office. How do you obtain it? If you’re one of the 232 million Spotify users, you’ll simply open the app, search for the song and add it to your playlist. Within seconds, you’ll have the song ready to play whenever and wherever you want.
This new norm of music streaming wasn’t always the status quo. In the early days of the internet, the process of finding music was easy but nowhere nearly as easy as it is now. You’d often still be able to find any song you wanted, but you would need to purchase it individually or as part of an album, download it to your computer and then sync it across to a portable music player like the iPod.
Spotify is a prime example of successful human-centered design. The music service directly addresses the primary pain points with accessing music and building music collections by allowing users to pay a monthly fee and immediately gain access to a significant catalog of the world’s music.
It’s also far from the only example. Take HelloFresh, for example. Founded by Dominik Richter, Thomas Griesel and Jessica Nilsson in 2011, this company delivers a box of ingredients and recipes to your door each week, meaning there’s no need for grocery shopping or thinking about what to cook. It’s a service that addresses a fairly common problem: People struggle to find the time to go out and buy groceries and also create tasty, healthy meals, so the founders addressed both issues.
Both HelloFresh and Spotify are solutions to real user problems. They weren’t born as a result of people sitting in a black box and trying to come up with new products or services. This is the core of human-centered design – identifying something that people have trouble with and then building an appropriate answer.
But, someone is likely to ask, what’s even the point of human-centered design? Shouldn’t all products and services be designed for the people using them? Well, yes.
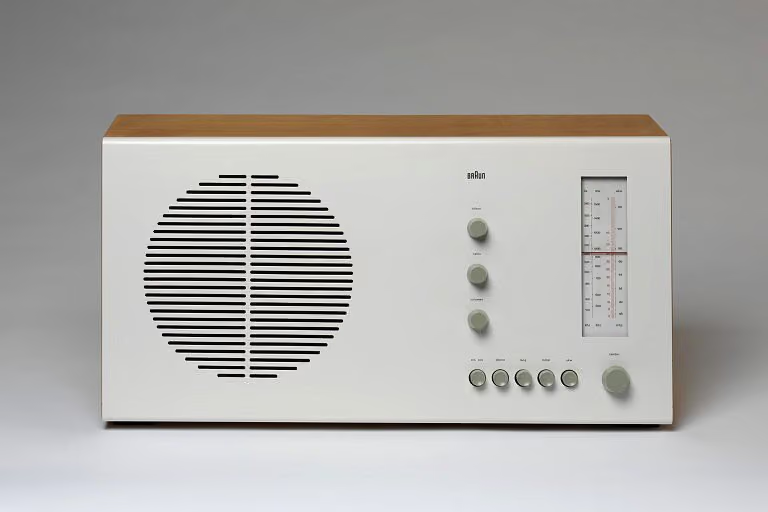
Interestingly, while terms like human-centered design and design thinking have become much more popular in recent years, they’re not entirely new methods of design. Designers have been doing this same work for decades, just under a different name: design. Just take one look at some of the products put together by famed industrial designer Dieter Rams (who famously influenced ex-Apple design lead Jony Ive). You can’t look at the product below and say it was designed without the end user in mind.
Why did human-centered design even gain traction as a term? David Howell (a UX designer from Australia) explains that designers often follow Parkinson’s Law, where “work expands so as to fill the time available for its completion”. He notes that designers could always do more (more user research, more ideation, more testing, etc), and that by wrapping everything under a single umbrella (like human-centered design) designers can “speak to their counterparts in business as a process and elevate their standing, getting the coveted seat at the table”.
Human-centered design, for all intents and purposes, is really just a way for designers to package up the important principles intrinsic to good design and sell them to those who may not be sympathetic to exactly why they’re important. At a broader level, the same thinking can be applied to UX as a whole. Good user experience should naturally fall under design, but occasionally a different way of looking at something is necessary to drive the necessary progress.
So human-centered design can really just be thought of as a vehicle to sell the importance of a user-first approach to organizations – that’s useful, but how exactly are you supposed to start? How do you sell something that’s both easily understandable but at the same time quite nebulous? Well, you sell it in the same way you’d sell user research.
In the simplest terms, a product designed and built based on user input is going to perform better than one that was assembled based on internal organizational thinking.
When utilized in the right way, taking a human-centered approach to product design leads to products that resonate much more effectively with people. We looked at Spotify at the beginning of this article for a company that’s continuously adopted this practice, but there are countless others. AirBnB, Uber, Pinterest and more all jump to mind. Google and LinkedIn, meanwhile, serve as good examples of the ‘old guard’ that are starting to invest more in the user experience.
In 2013, Microsoft was set to unveil the latest version of its Xbox video game console. Up until that point, the company had found significant success in the videogame market. Past versions of the Xbox console had largely performed very well both critically and commercially. With the newest version, however, the company quickly ran into problems.
The new ‘Xbox One’ was announced with several features that attracted scorn from both the target market and the gaming press. The console would, for example, tie both physical and digital purchases to users’ accounts, meaning they wouldn’t be able to sell them on (a popular practice). The console would also need to remain connected to the internet to check these game licenses, likely leading to significant problems for those without reliable internet access. Lastly, Microsoft also stated that users would have to keep an included camera system plugged in at all times otherwise the console wouldn’t function. This led to privacy advocates arguing that the camera system’s data could be used for things like targeted advertising and user surveillance.
Needless to say, after seeing the response from the press and the console’s target market, Microsoft backtracked and eventually released the Xbox One without the always-on requirement, game licensing system or camera connection requirement.
Think of the costs Microsoft likely incurred having to roll back every one of these decisions so late into the product’s development. If you’re able to identify an issue in the research or prototype phase, it’s going to be significantly cheaper to fix here as opposed to 3 years into development with a release on the horizon.
As the Spotify founders discovered back in back in 2008, taking a human-centered approach to product design can lead to revolutionary products and experiences. It’s not surprising. After all, how can you be expected to build something that people want to use without understanding said people?
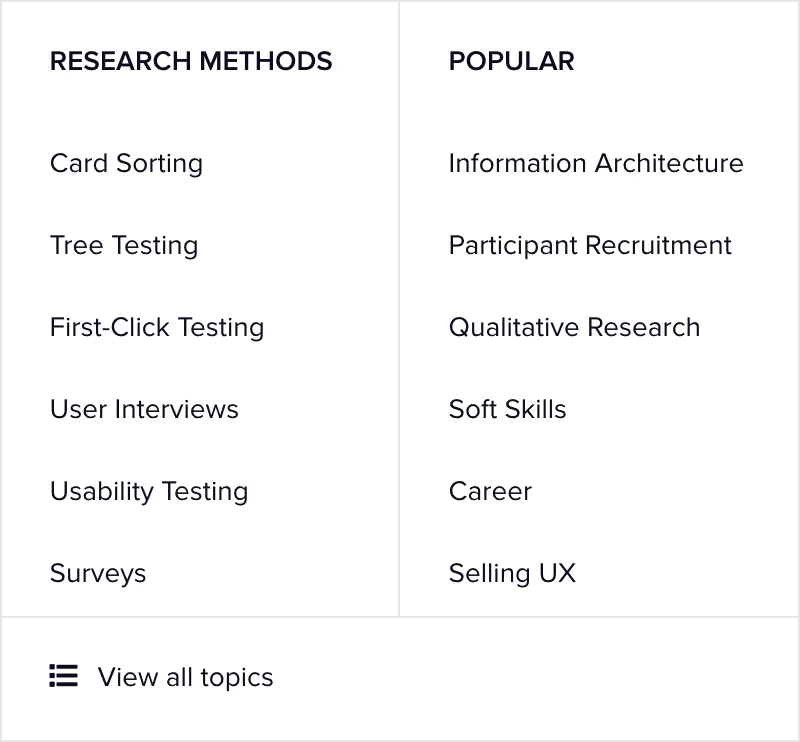
Take a look at the navigation menu at the top of our blog. Mouse over the ‘Explore by topic’ menu and browse through the different elements.
If you’re new to the world of website architecture and UX, developing something like this may seem quite trivial – surely it’s just a matter of picking 'popular' areas of your website and dropping them in, right?
Not exactly.
When it comes to website design, navigation should sit at the top of the priority list. After all, it’s what sits between your user and their goal. It’s the critical link that’s usually the deciding factor in whether or not they’ll continue to use your website.
In this article, we’re going to cover off some of the key things that make for a good website navigation experience. But first, it’s important to dispel some confusion.
According to Wikipedia, “web navigation refers to the process of navigating a network of information resources [like content]”. This is key. Website navigation isn’t the design of a website, it’s the bones of a website – the core structure that sits beneath the design. It can be helpful to think of it like a freeway system linking drivers (users) to destinations (content). Without a navigation, or, as is more often the case, with a poor navigation, the experience of using a website falls over. And in real terms, this is going to impact whatever it is that your organization does.
There’s no shortage of elements that play into the user experience of a website. Everything from font, color, imagery, headlines, call to actions, page load time and form design have a bearing on the end user experience. But navigation is really the most important consideration of all. If people can’t find what they’re looking for within the structure of your website, they’ll likely leave and look for that same content elsewhere.
If you run an ecommerce website selling cosmetics, a frustrating navigation experience could mean your customers simply get fed up and try one of your competitors instead.
When looking at what separates merely functional website navigation experiences from great ones, there are a number of key considerations:
Website navigation bars have a habit of either including far too many links or not enough – it’s important to strike the right balance. You may find it helpful to consider the following 2 factors when designing your own navigation:
The difference in a user’s goals and your own is important. While your users may want to find information about your company history, you’ll have your own goals of getting users to product pages or perhaps signing up for accounts.

We’re not going to get into the specifics of structuring a brand tone and style here, but we’ll just note the following: Clear is kind. Unclear is unkind. This is an important rule to keep in mind when designing the labels/UX copy for your navigation items. You want people to immediately understand what they’re reading or about to click on – there should never be any confusion. When your confusing labels send users on a mission to find something that should be easily discoverable, there’s a good chance they won’t return to your website.
So what does this look like? Here are a couple of examples:
Web conventions exist for a reason – they’re based on ideas that work and are understood by the majority of web users. In many cases, these conventions work so well that most people will be able to navigate websites in entirely different languages simply because the functions are located in places that make sense.
When we redeveloped the Optimal Workshop blog at the beginning of 2019, we ran a series of usability tests on our website to work out how our users navigated their way through different types of content. The results were pretty interesting. When we asked people to find a link to our blog, many didn’t go for the ‘Learn’ menu in our navigation bar but instead went straight down to the footer at the bottom of the page.
Often overlooked, the footer forms a key function in your website’s navigation experience, for a few key reasons:
Building a navigation system that’s intuitive and understandable by the majority of your users isn't easy – but it’s not impossible. The first step on the path to creating such a navigation begins with an understanding of how your users think. Or, more specifically, how your users think the information on your website should be arranged.
One of the methods that we use to figure this out is called card sorting. With card sorting, you can work out how people understand and categorize information. In a typical card sort, you task participants with sorting cards containing different items into groups. You can then use the results to figure out how to group and label the information on your website in a way that makes the most sense to the people using.
The other technique that proves invaluable during the website design process is called tree testing. It’s best-suited to help you assess the findability of topics on a website. You run a tree test on a text-based frame of your website – there are no navigation aids or design elements to give any hints. By removing everything but the labels and how they’re, you can work out how effective your navigation is at getting people to the content they’re looking for. If you find that test participants consistently struggle to locate specific items, you’ll know there are issues with your structure.
These are 2 methods that can help you with website navigation design, but they make great starting points. You can use card sorting to get an idea of how people think information should be grouped, turn this into a rough structure of your website, test it, and then iterate. If you’d like to give card sorting and tree testing a try, give our UX platform a go.

