Subscribe to OW blog for an instantly better inbox
Oops! Something went wrong while submitting the form.

The term ‘usability’ captures sentiments of how usable, useful, enjoyable, and intuitive a website or app is perceived by users. By its very nature, usability is somewhat subjective. But what we’re really looking for when we talk about usability is how well a website can be used to achieve a specific task or goal. Using this definition we can analyze usability metrics (standard units of measurement) to understand how well user experience design is performing.
Usability metrics provide helpful insights before and after any digital product is launched. They help us form a deeper understanding of how we can design with the user front of mind. This user-centered design approach is considered the best-practice in building effective information architecture and user experiences that help websites, apps, and software meet and exceed users' needs.
In this article, we’ll highlight key usability metrics, how to measure and understand them, and how you can apply them to improve user experience.
Usability metrics aim to understand three core elements of usability, namely: effectiveness, efficiency, and satisfaction. A variety of research techniques offer designers an avenue for quantifying usability. Quantifying usability is key because we want to measure and understand it objectively, rather than making assumptions.
There are a few key metrics that we can measure directly if we’re looking to quantify effectiveness, efficiency, and satisfaction. Here are four common examples:
Usability metrics are outputs from research techniques deployed when conducting usability testing. Usability testing in web design, for example, involves assessing how a user interacts with the website by observing (and listening to) users completing defined tasks, such as purchasing a product or signing up for newsletters.
Conducting usability testing and collecting usability metrics usually involves:
Tools such Reframer are helpful in conducting usability tests remotely, and they enable live collaboration of multiple team members. It is extremely handy when trying to record and organize those insightful observations! Using paper prototypes is an inexpensive way to test usability early in the design process.
User-centered design challenges designers to put user needs first. This means in order to deploy user-centered design, you need to understand your user. This is where usability testing and metrics add value to website and app performance; they provide direct, objective insight into user behavior, needs, and frustrations. If your user isn’t getting what they want or expect, they’ll simply leave and look elsewhere.
Usability metrics identify which parts of your design aren’t hitting the mark. Recognizing where users might be having trouble completing certain actions, or where users are regularly making errors, are vital insights when implementing user-centered design. In short, user-centered design relies on data-driven user insight.
But why hark on about usability metrics and user-centered design? Because at the heart of most successful businesses is a well-solved user problem. Take Spotify, for example, which solved the problem of dodgy, pirated digital files being so unreliable. People liked access to free digital music, but they had to battle viruses and fake files to get it. With Spotify, for a small monthly fee, or the cost of listening to a few ads, users have the best of both worlds. The same principle applies to user experience - identify recurring problems, then solve them.
Usability metrics should be analyzed by design teams of every size. However, there are some things to bear in mind when using usability metrics to inform design decisions:
Remember, data analysis is only as good as the data itself. Give yourself the best chance of designing exceptional user experiences by collecting, researching, and analyzing meaningful and accurate usability metrics.
Usability metrics are a guiding light when it comes to user experience. As the old saying goes, “you can’t manage what you can’t measure”. By including usability metrics in your design process, you invite direct user feedback into your product. This is ideal because we want to leave any assumptions or guesswork about user experience at the door.
User-centered design inherently relies on constant user research. Usability metrics such as success rate, time-based efficiency, number of errors, and post-task satisfaction will highlight potential shortcomings in your design. Subsequently, they identify where improvements can be made, AND they lay down a benchmark to check whether any resulting updates addressed the issues.
Ready to start collecting and analyzing usability metrics? Check out our guide to planning and running effective usability tests to get a head start!

Understanding your customers is central to any organization which wants to deliver an outstanding experience. But how do you understand your customers better? Tailoring their experience with your products and your organization to suit them should include a customer journey map.
It doesn’t mean your organization needs a brightly colored, fully designed infographic that outlines each and every action your user takes within your product. It does mean an effective customer journey map that promotes empathy and provides a clear vision for improving customer interactions. There are no rules around what that visualization looks like and it is up to your team to create one that makes the most of your customer’s journey.
Customer journey mapping (sometimes referred to as a user experience map) is a technique that allows you to visualize your customer’s key touchpoints, sentiments, pain points, and actions. Plotted in sequential order. It’s a map of a customer’s experience with your brand or product, from awareness to purchase and beyond.
Customer journey mapping helps you look beyond key touchpoints and encourages empathy with your customers. To understand who they are, even a persona to give them a life and demographic. Helping designers and key stakeholders understand where they are coming from. And where you can address their needs, avoid their pain points and encourage them to engage with your product. And even identify opportunities for innovation and improvement across the board.
What’s better than a customer that feels seen and understood once? A customer that feels the organization or product really understands their needs (and responds to their frustrations). Like all successful, long-term relationships, keeping customers returning is built on empathy and a solid grasp of their needs and frustrations.
When you want to get to know your customer, like really get to know them, it’s essential to map their customer journey. Creating a shared understanding of what your customers think, feel, and struggle with as they interact with your organization. Spending the time to establish a customer journey map can help align around identifying known problems, identifying new user pain points, and removing roadblocks for your customers, ensuring their success.
Spending the time to get inside the mind and journeys of your customers through mapping helps your team to:
Here are 8 key steps to get the most out of your customer journey map process:
Each and every customer’s journey is different. This, of course, means that there is no single best customer journey map example or template. Instead, the best customer journey map for any given situation will depend not only on your customers but also on your product, your team, and the goals you’re hoping to achieve by creating the map in the first place.
We’ve found a few examples of customer journey maps to help inspire your thinking:
Current state customer journey maps help you to visualize a user’s experience as it is right now. These are fact-based journey maps - to create an accurate, current state journey map. A good dose of user research data around your actual customers and interactions will help shape this.
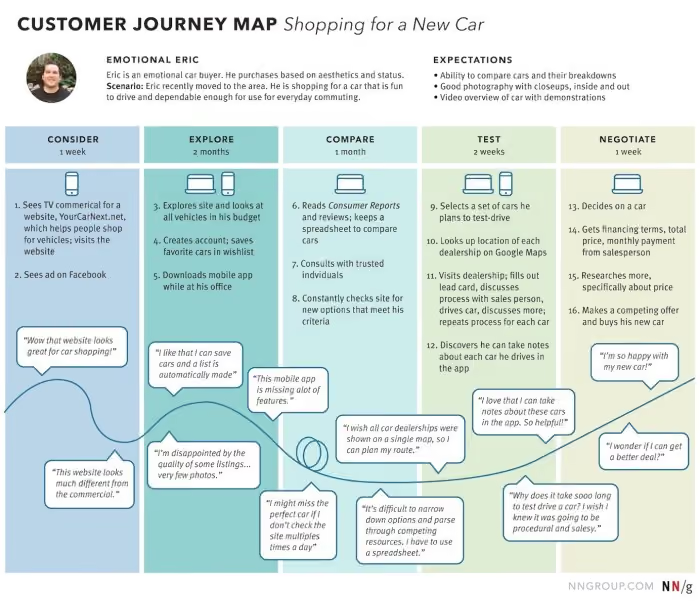
Future state customer journey maps focus on what the customer journey can and should look like in the future. Although UX data is certainly an important aspect of understanding customers, future state journey maps involve a fair amount of creative speculation and interpretation. These customer journey maps focus on customer hopes and wants (future feelings), in addition to experiences and reactions. They can be a little objective and should be developed in balance with both positive and negative interactions.
Day in the life customer journey maps help you visualize your customer’s entire daily routine. Interactions with family, their commute, work meetings, afternoon coffee, etc. Regardless of whether or not the activities are related to your company. This type of journey map should be organized chronologically to give key insights into how and where customers are. What are the distractions, and where could they interact with your brand or product? How can key pain points be eased?
Service blueprints are a useful counterpart to a classic customer journey map. Whereas a customer journey map focuses on the thoughts, needs, and actions of the customer, a service blueprint reflects the perspective of the organization and its employees. What needs to happen behind the scenes to ensure the customer’s experience is the very best it can be.
Circular customer journey maps may be useful to visualize the customer journey as a circle or loop. Recognizing that some customers are recurring and non-transactional. Particularly through subscription-based relationships.
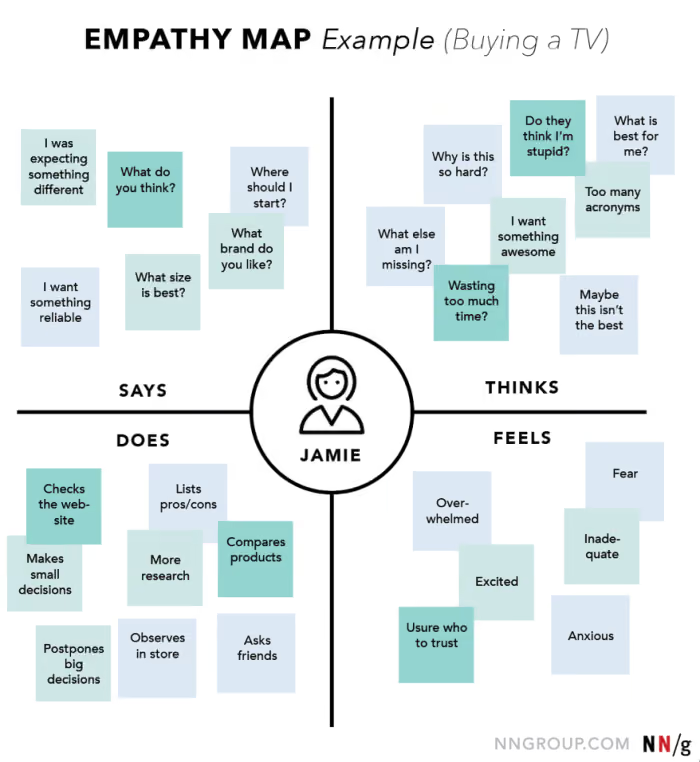
An empathy map is used to create a shared understanding of customers around their wants, needs, thoughts, and actions. This can be a great starting point to getting under your customer’s skin.
There is no one size fits all customer journey map. Each customer is unique, each organization is different. Through creating customer journeys, personas and visualizing their key touchpoints, pain points, and understanding who they are, empathy throughout the organization can be generated. With this as a tool to bring key stakeholders on board and to pinpoint where products (and services) can be improved to keep customers or even bring new ones on board, the user experience can be better and more effective.

Ever wondered what the relationship is between information architecture (IA) and UX? Simply put, IA is the foundation of UX. We outline why.
According to Abby Covert, a leader in the field of information architecture, IA is ‘the way we arrange the parts to make sense of the whole.’ This can relate to a website, a retail store or an app. And you could even consider the way a library is sorted to be information architecture. For the purposes of this article, we will focus on digital products (apps or websites).
Well-organized information architecture is fundamentally important to the success of your product. As a designer, knowing the content you are delivering and how, is fundamental to creating a UX that performs. Working with the needs of the organization and meeting the requirements of the users in a meaningful and delightful way. Organizing and structuring the information so that navigating, searching, and understanding your product is seamless is ultimately what UX design is all about. Arranging the parts to make sense of the whole, you could say.
While design is about creating visual pointers for users to find their way, information architecture can be broken down into 3 main areas to consider when building a great user experience:
When put like this it does seem pretty straightforward. Maybe even simple? But these tasks need to be straightforward for your users. Putting thought, time, and research at the front of your design and build can increase your chances of delivering an intuitive product. In fact, at any point in your product’s life cycle, it’s worth testing and reviewing these 3 areas.
Developing a well-thought-out and researched information architecture for your product could be considered a foundation step to creating a great UX product. To help you on your way, here are 6 key things to consider when building effective information architecture for a great user experience.
Information architecture is the foundation of designing a great product that meets (or even exceeds) your users’ needs, wants, and desires. By balancing an organization’s needs with insight into what users actually want, you’re well equipped to design an information architecture that helps build a product that delivers a positive user experience. Research, test, research, and test again should be the mantra throughout the development, design, and implementation of your product and beyond.
There is an enormous amount of information on the internet. Every page you load is crammed with it. With so much information around, it’s incredibly important to remember that for human minds to be able to actually process and make sense of it, considered, strategic, ordered information architecture is needed.
Information architecture is everywhere digitally, but where does it actually live? IA sits in behind all of the digital interfaces we humans use (and even out in the real world). It ideally has been considered, researched, and implemented with humans in mind, though as we all know, this isn’t always the case.
Information architecture always has a role to play, and here we’ll focus on 4 key digital spaces where information architecture is most prominent, and likely most familiar.
To find out more about putting information architecture into action check out our blog.
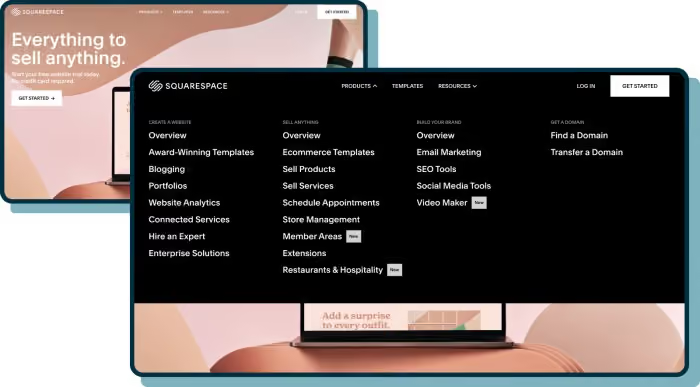
Information architecture for websites can often be confused with navigation. While site navigation is super important, (think of it as the ‘skin’ that sits above the information), that’s only part of the story. Great website architecture considers and organizes user requirements, organizing the content and structure of the website with labels, search and navigation that simply makes sense and is easy to use. Done well, it will feel simple and straightforward, guiding users through smoothly.
Hubspot has a great article on IA for websites and how they can be structured. From a complex library system, to travel booking systems. Each has its own needs and can be quite deep in layers of information. The trick is to create a website structure, based on user needs, that makes sense of the piles of information and a simple navigation that sits above, making the journey to task completion as quick as possible. Working together they make any user experience feel quick, simple, and intuitive!

An organization's app acts as the first point of contact. It needs to be super simple, clean, and quick to interact with. A well thought out, thorough, researched, and organized information architecture plays a big part in this.
Information architecture for mobile use has a different set of rules than websites. The key consideration here is around the ease of use across a smaller screen. Navigation that makes sense for a laptop or desktop computer can be clunky in a mobile app.
An app's interface needs to have fewer options, and fewer clicks to complete the task. Researching and designing an app’s IA with just the right amount of information is key. Some retail apps are simplified websites, whereas other apps exist on their own merits, with no need for a website.
Bringing it back to the humans that will interact with the app is key to creating a product that delivers on user requirements and increases interaction.

An organizational intranet is possibly less of a priority than a website or an app but is vitally important to the success of an organization. And in these times of remote or hybrid working, intranets have proven to be more valuable than ever. An intranet is more than where to stick newsletters for staff, it is an interface that can make or break the productivity or even the wellbeing of an organization.
Access to files, information, messaging platforms, and corporate requirements wherever and whenever people are working is more important than ever. A well researched and designed information architecture can build an intranet that meets users’ requirements, increase communication and interaction and ultimately boost productivity.
Conducting UX research with staff on what they need to access, when, and how will help inform the intranet IA far more intuitively. The information available (and needed) can be huge, keeping it simple and human focused is key.
Have you ever thought about how poor internal information architecture might be hurting your business?

Social media software is complex in terms of ecosystem and display of information. Each social media platform has developed over time, think back to Facebook and how it looked when it initially launched. And through the uptake of users, gathering of information over time, and continual research and testing, it has evolved into what we see today. And will continue to evolve with users’ needs.
Every user has a different experience based on the individuals, groups, organizations and even retailers that they choose to interact with (or haven’t chosen via advertising). The piles of information that sit behind and are brought to the interface for an individual through their choice, associations, labels, tags, interests, age, etc will present them with a unique feed.
The interface of a social media platform needs to be considered, tested, tested again, and occasionally tested or changed once launched as the interaction of users is vitally important.
The information architecture sitting behind is huge in order to enable the agility to pull the right information forward in a dynamic and coherent way. Continuously learning, testing and requesting interaction from users through options to ‘hide’ posts that aren’t appropriate or respond to direct queries about what they do and don’t want to see are just some instances of continuous user research.
Social media continues to be a sophisticated information architecture that is constantly updating and changing with user needs.
Information architecture lives wherever there is information needing to be found by humans. Successful information architecture is sorted, organized and labeled in a way that is simple, intuitive, and considered. Making interaction and life simple, which in a world where there are an increasing number of websites, apps, and tools to choose from – intuitive information architecture has never been more important for your business and your customers.

Return on investment (ROI) is often the term on everyone’s lips when starting a big project or even when reviewing a website. It’s especially popular with those that hold the purse strings. As UX researchers it is important to consider the ROI of the work we do and understand how to measure this.
We’ve lined up 5 key ways to measure ROI for UX research to help you get the conversation underway with stakeholders so you can show real and tangible benefits to your organization.
Put simply, a product that meets and exceeds user expectations leads to increased revenue. When potential buyers are able to find and purchase what they’re looking for, easily, they’ll complete their purchase, and are far more likely to come back. The simple fact that users can finish their task will increase sales and improve overall customer satisfaction which has an influence on their loyalty. Repeat business means repeat sales. Means increased revenue.
Creating, developing and maintaining a usable website is more important than you might think. And this is measurable! Tracking and analyzing website performance prior to the UX research and after can be insightful and directly influenced by changes made based on UX research.
Measurable: review the website (product) performance prior to UX research and after changes have been made. The increase in clicks, completed tasks and/or baskets will tell the story.
UX research done at the initial stages of a project can lead to a reduction in development time of by 33% to 50%! And reduced time developing, means reduced costs (people and overheads) and a speedier to market date. What’s not to love?
Measurable: This one is a little more tricky as you have saved time (and cost) up front. Aiding in speed to market and performance prior to execution. Internal stakeholder research may be of value post the live date to understand how the project went.
And the double hitter? Creating a product that has the user in mind up front, reduces the need to rehash or revisit as quickly. Reducing ongoing costs. Early UX research can help with the detection of errors early on in the development process. Fixing errors after development costs a company up to 100 times more than dealing with the same error before development.
Measureable: Again, as UX research has saved time and money up front this one can be difficult to track. Though depending on your organization and previous projects you could conduct internal research to understand how the project compares and the time and cost savings.
Did you know that 70% of projects fail due to the lack of user acceptance? This is often because project managers fail to understand the user requirements properly. Thanks to UX research early on, gaining insights into users and only spending time developing the functions users actually want, saving time and reducing development costs. Make sure you get confirmation on those requirements by iterative testing. As always, fail early, fail often. Robust testing up front means that in the end, you’ll have a product that will meet the needs of the user.
Measurable: Where is the product currently? How does it perform? Set a benchmark up front and review post UX research. The deliverables should make the ROI obvious.
Thanks to UX research you can find out exactly what your customers want, need and expect from you. This gives you a competitive advantage over other companies in your market. But you should be aware that more and more companies are investing in UX while customers are ever more demanding, their expectations continue to grow and they don’t tolerate bad experiences. And going elsewhere is an easy decision to make.
Measurable: Murky this one, but no less important. Knowing, understanding and responding to competitors can help keep you in the lead, and developing products that meet and exceed those user expectations.
Showing the ROI on the work we do is an essential part of getting key stakeholders on board with our research. It can be challenging to talk the same language, ultimately we all want the same outcome…a product that works well for our users, and delivers additional revenue.
For some continued reading (or watching in this case), Anna Bek, Product and Delivery Manager at Xplor explored the same concept of "How to measure experience" during her UX New Zealand 2020 – watch it here as she shares a perspective on UX ROI.
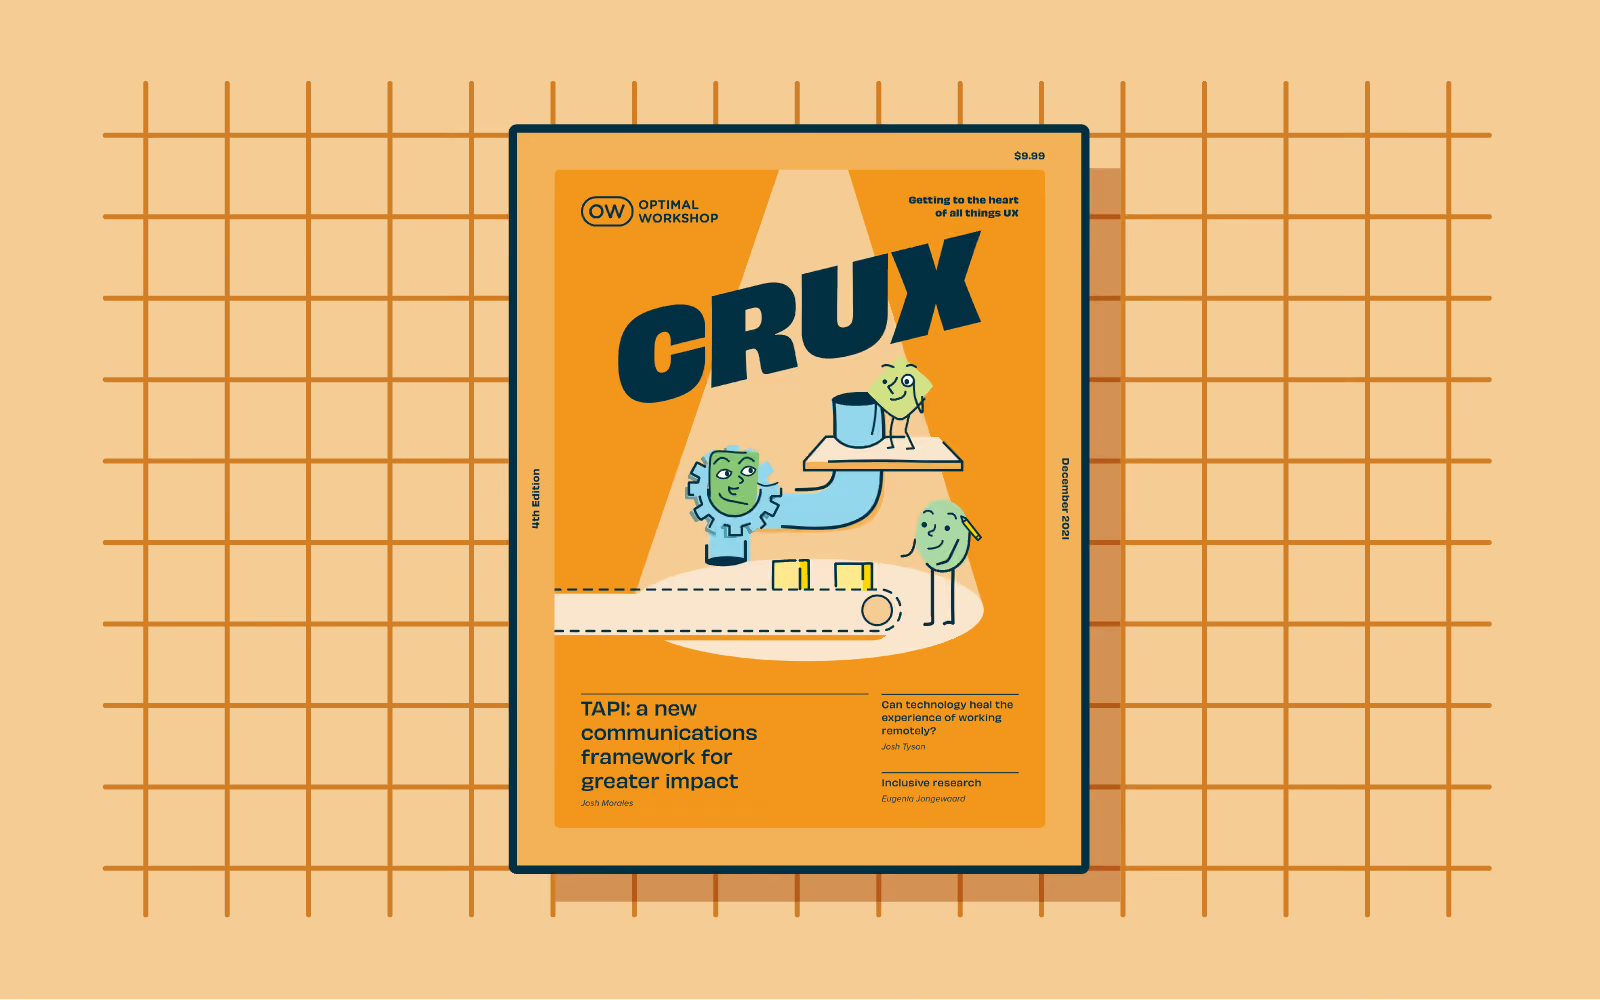
As the fourth issue of CRUX goes to press the demand for usability continues to grow, along with the rise of the digital experience economy. Sharing a sense of community among UXers is more important than ever. That’s why we’re so proud to bring you our latest issue of CRUX, celebrating people and perspectives from the UX community.
CRUX #4 has a great line-up of contributors, all experts in their fields who jumped at the opportunity to share their thoughts and ideas with us - and of course more importantly - you.
This issue we’ve focussed on collaboration and invited our contributors to bring their thoughts and ideas on communication and teamwork to the table. They’ve come up with some compelling reading that inspires, surprises and at times challenges current thinking and offers fresh perspectives.
"In a word: your findings virtually do not exist if you don’t communicate them well."
“Designers are just as vulnerable to the blindspots and errors of cognitive bias as the people who use our products. After all, we're humans,too.”
“As we live in a world of rapid digital transformation we can't continue to design in the same way we designed before. We should start designing for inclusion. For that to happen we need to shift our mindset towards inclusive research.”
Do you have a burning idea to share or a conversation you’re dying to kickstart that’s of interest to the world of UX? Now’s your chance. We’re already on the lookout for contributors for our first edition of CRUX for 2022. To find out more please drop us a line
But for now, get comfortable and settle in for a good read. Welcome to CRUX #4.

