Subscribe to OW blog for an instantly better inbox
Oops! Something went wrong while submitting the form.
.webp)
2025 is already proving to be an exciting year for UX research, and we’re just getting started! With a range of new features and updates that empower teams to move from design to decisions faster, Optimal is bringing the best tools to the table for everyone and making research accessible across all teams. Let’s dive into what’s already here and what's coming next!
Video Recording for Prototype Testing
We’re excited to announce that the closed beta for video recording for prototype testing has launched. By capturing screen, audio, and/or video, this feature takes research beyond metrics to give you a deeper understanding of user intent and pain points. Our Optimal Recruitment service also ensures you connect with the right participants for video recording, driving meaningful insights from the start.
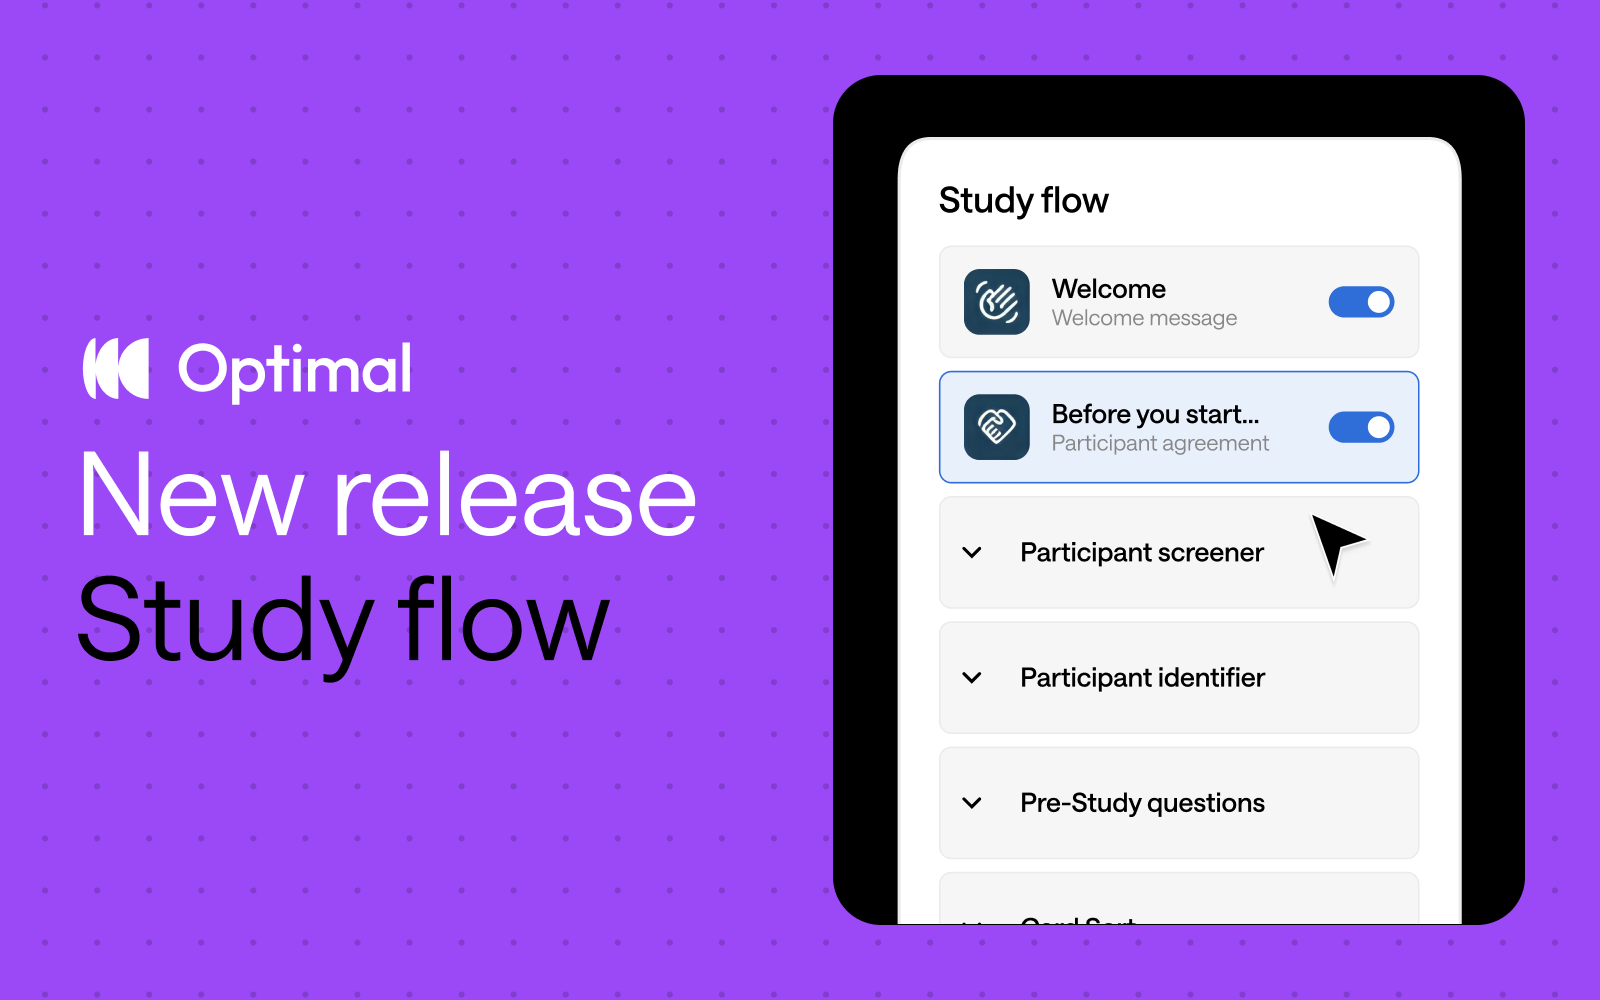
New Study Flow for Faster Study Creation
Say hello to the new Study Flow, an intuitive tab that helps to accelerate study creation, combining the Messages & instructions and Questionnaire tabs into one. Visualize every step of the participant’s journey, from the welcome screen to the final thank-you message with the Study Flow panel. Save time by quickly duplicating questions across Surveys and other study types. Navigate through studies with ease by collapsing and expanding sections as needed.
Here’s a sneak peek at some exciting features in the works:
AI-Powered Survey Question Simplification
We’re unleashing an AI-powered feature to help users simplify complex question wording and improve clarity. Users can quickly accept, reject, or regenerate more suggestions with a click. By improving clarity and simplifying your questions, you’ll gather more accurate, higher-quality insights that drive better results.
This AI feature is available for surveys questions as well as screening, pre and post study questions for surveys, prototype tests, card sorts, tree tests and first-click tests. This is just the beginning of even more AI-driven improvements to come, all aimed at helping to accelerate your time to insights.
Advanced Logic Capabilities
We’re working on bringing more advanced logic capabilities to Optimal - one of the most highly requested features for surveys. With display logic, the study changes dynamically - showing or hiding answer options or subsequence questions based on a participant’s previous responses. Apply display logic to Surveys, screening questions, and pre- and post-study questions. This is just the beginning. We’ll be exploring additional advanced logic capabilities in 2025.
Join Us on the Journey
Stay tuned for regular updates, and let us know how we can make your research experience even better. Have feedback or feature requests? We’d love to hear from you so we can continue to shape the future of Optimal.
Inspired by insights from Optimal users, we’ve reimagined study creation to bring you a beautifully streamlined experience with the new Study Flow tab.
⚡ Enjoy faster study set up: Messages & instructions and Questionnaire tabs are combined in a single tab - called Study Flow - for faster editing and settings customization.
✨ See it all at a glance: Easily visualize and understand the participant experience—from the welcome message to the final thank-you screen—every step of the way.
🎯 Duplicate questions: Save time and quickly replicate questions for surveys, screening questions, and pre- and post-study questions.
⭐ Experience enhanced UI: Enjoy a modern, clean design with intuitive updates that minimize scrolling and reduce mental load.
🗂️ Collapse and expand sections: Easily navigate studies by collapsing and expanding sections, making it easier to build out specific parts of your study.
This Study Flow tab is available across all Optimal tools, except for Qualitative Insights.
We’re not stopping there. We have some significant improvements on the horizon designed to give you even greater flexibility and control.
Advanced logic: Enhanced logic capabilities is one of our most highly requested features, and we’re thrilled to introduce new capabilities to help you build your ideal study experience – available for surveys and other tools. We will first introduce “display logic”, allowing for:
Customizable sections: Organize your questions into different sections to build a better study experience for your participants. For example, segment your questions into relevant groupings, such as demographics or product usage. With custom sections, you can add new sections, rename, reorder, duplicate, and move questions between different sections.*
*Note: Questions cannot be moved to/from the screening questions section.
These upcoming features will empower you to create dynamic, tailored study experiences for different audiences with ease for more valuable insights.
Start exploring the new Study Flow now.
As we approach the end of 2024, it’s a great time to reflect on the progress we’ve made as a community and at Optimal. This year, Optimal users launched over 100,000 studies with over 1.2 million participants sharing insights to drive better business decisions and experiences.
Here's how we’ve worked to make research more accessible, speed up insight discovery, empower enterprise teams, and grow our platform’s capabilities in 2024.
Research for All
Research shouldn’t be limited to specialists or select teams—it should be accessible to everyone. In 2024, we focused on breaking down barriers to user research so that individuals across all divisions and teams can uncover actionable insights. Our tools are built to help anyone make confident, user-centered decisions, and this year, we’ve seen Optimal users from across all different types of teams, including product, marketing, content, research, design, information architecture, and education. We work to make our platform easy to use and learn, ensuring everyone can dive into research without barriers, regardless of their role or experience.
A Milestone Year for UX Maturity
Understanding and improving UX maturity became a key focus for organizations this year. We launched our comprehensive UX Maturity Framework, complete with assessment tools that help teams identify their current state and plot a path forward. To support this journey, we developed detailed playbooks for each maturity level, offering practical guidance for teams looking to level up their UX practice.
Demonstrating the Value of UX
The conversation around UX value also took center stage in 2024. Our groundbreaking research into quantifying UX impact provided organizations with concrete data to support their UX investments. Through our popular webinar and blog series, we explored different approaches to communicating UX value to stakeholders, giving practitioners the tools they need to advocate for user-centered design.
Prototype Testing
This year, we introduced Prototype Testing, enabling teams to test designs early and often. Teams can iterate quickly and ensure their ideas resonate with users before committing to development.
Video Recording (Beta)
We added a new feature to Prototype Testing that captures screen, audio and nonverbal cues—such as frustration—providing deeper insights into your users' experiences.
Figma Integration
We also launched Figma integration for First-Click Testing and Prototype Testing, allowing users to connect design prototypes directly to Optimal studies. This integration makes it easier than ever to test, refine, and align designs with user needs—all without leaving Optimal.
AI-Powered Insights
Our AI-Powered Insights help to uncover patterns and themes in qualitative and interview data. By analyzing large datasets, AI helps you discover key trends and accelerate decision-making.
Optimal Recruitment
Recruiting high-quality participants can be a huge hassle and very time-consuming. That’s why we’ve relaunched Optimal Recruitment with expanded profiling capabilities, enhanced quality controls, and full-service support—to let you focus on what matters most: powerful insights to drive better business outcomes
Workspaces
For organizations with complex structures, we’ve introduced Workspaces and Projects to give admins greater control, improved organization, and increased privacy controls. Whether you're part of a large enterprise or a growing team, these enhancements simplify governance and amplify impact.
Looking Ahead
As we head into 2025, our roadmap is packed with exciting features and improvements to make research more accessible, efficient, and impactful. Expect advancements across our platform, including video recording for prototype testing, a brand new survey tool with improved usability, advanced logic, and AI-powered capabilities to meet the evolving needs of teams worldwide. The best is yet to come - stay tuned and see you in 2025!

After months of invaluable collaboration with our incredible community, we're thrilled to announce that Prototype Testing has officially graduated from beta and is now available to everyone on the Individual+, Team, and Enterprise plans!
The Prototype Testing Beta was launched with a singular mission: to gather feedback from our community to help shape the future of the tool. Over the past few months, we've been privileged to work alongside a diverse group of customers and UX leaders— who provided invaluable feedback, completed many Usability Tests, and helped us refine the tool.
From the initial rollout to the most recent updates, your input has shaped our decisions, from design tweaks to functional improvements. Together, we’ve tackled challenges, explored creative solutions, and built something that truly aligns with user needs.
We're thrilled to announce our most requested feature is coming to Prototype Testing: seamless video recording that captures the full depth of user experiences.
Video recording transforms your research by:
Your feedback during the beta has shaped an exciting roadmap for 2025 and beyond. While we can't reveal everything just yet, know that every feature and enhancement planned has been inspired by your needs and suggestions.
To our incredible beta participants: your partnership has been invaluable. You've shared your expertise, challenged our assumptions, and helped us build something truly special. Every piece of feedback, every suggestion, and every bug report has contributed to making Prototype Testing a tool that truly serves the UX research community.
This is just the beginning of our mission to make expert research accessible to all. Stay tuned for regular updates as we continue to evolve Prototype Testing based on your needs and feedback. Here's to the next chapter of creating exceptional digital experiences together!

We've been hard at work enhancing your research capabilities, and we're excited to share what's new at Optimal. Here's what we've shipped to help you uncover even deeper insights:
Since launching the Beta, we've been collaborating closely with hundreds of Optimal customers to gather feedback and run usability testing. Your support has been invaluable, and we’re excited to announce these latest updates for Prototype Testing:
Improved security with password management: A new "Password settings" button allows users to manage stored passwords, which participants receive before starting their Prototype Study. Additionally, users are prompted for a password when importing protected prototypes.
Improvements to usability: Your feedback was taken onboard, and we’ve updated the buttons, including "Re-sync to file" and "Change prototype," to improve usability.
Results sharing: You can now easily share specific sections (e.g., analysis, tasks, clickmaps) via a URL with your stakeholders in just a few clicks. With the added protection of a password for secure access.
Participant data view: To speed up your data analysis and improve your workflows we’ve added task metrics in the "Results > Participants" table, showing tasks completed, skipped, and success percentage.
Notes tab in analysis: Users can now take notes directly in the Analysis section for Task Results, Click Maps, Paths, and Questionnaires.
This release makes it easier for users to analyze data faster with flexible export options and an improved format for questionnaire and survey downloads. Find out more about the updates below.
To get started, navigate to the Downloads tab under Results. Results Downloads are available for all tools except for Qualitative Insights.
We’re just days away from the re-launch of our Qualitative Insights tool, previously known as Reframer. This upgrade brings powerful new features to streamline and enhance your qualitative data analysis, making it faster, easier, and more insightful than ever.
With the new Insights feature, you can capture and organize key takeaways from studies more efficiently. Each Insight — which includes a title, description, and linked observations — will live under the new Insights tab, allowing you to quickly gather and manage critical findings. You can create Insights directly from your observations or leverage AI to accelerate insight discovery, surfacing hidden themes within your data.
AI-Driven Insights with full control: You and your organization retain complete control over AI usage. All AI-generated results are fully editable, giving you the flexibility to adjust or even turn off AI support for your studies. Use AI as much or as little as needed, with peace of mind over your data management.
Enhanced usability
Our survey relaunch focuses on significantly improving usability, making creating, editing, and launching surveys easier than ever. Key releases coming late 2024 include:
By the end of the year, we’ll be adding Video Recording to our Prototype Testing tool. This new feature will allow you to better understand user experiences, and gain even deeper insights during a Prototype test. Video recording will be browser-based, with no plug-in required, eliminating setup complexities. Participant consent to record screen, face and voice is all taken care of by Optimal and captured upfront in the testing process.
Join our research panel and influence Optimal's future! You'll get early access to new features and thank-you gifts for your time. Interested?
Email product@optimalworkshop.com

We’re excited to announce the latest updates to our platform to help teams test, validate and gain insights early in the design process. Looking ahead to the rest of 2024, stay tuned as we expand Optimal’s research capabilities with new tools and features, including Prototype Testing, Qualitative Insights, and upgraded Surveys along with enhanced admin management and user roles!
We’re thrilled to share the launch of our new Managed Recruitment offering with high quality and expanded profiling capabilities for hard-to-reach audiences. Managed Recruitment leverages our in-house recruitment team and a new powerful, award-winning panel — PureSpectrum — to give you access to millions of participants across 100+ countries. Optimal handles recruitment logistics from start to finish, guaranteeing quality responses and replacing low-quality participants at no extra cost.
Early access is now available. To get started, submit your criteria via the request form. Starting in early August, you’ll be able to access Managed Recruitment via the Optimal Recruit tab. Recruitment is available for all Optimal tools except for Qualitative Insights (Reframer).
The newest edition to the Optimal toolkit is just around the corner. Prototype testing will allow you to quickly test designs with users throughout the design process, to help inform decisions so you can build on with confidence.
You’ll have the option to easily import low or high-fidelity prototypes directly from Figma or build your own prototypes from scratch by uploading images or screenshots and creating clickable areas. Prototype testing allows you to Identify usability issues and areas for improvement throughout the design process to iterate and improve your designs quickly with your users.
After we launch Prototype testing, we’ll be adding Video Recording to allow you to record a participant completing a prototype test. You can capture nonverbal cues like eye rolls and frustration, screens and voices to better understand user experiences, and gain deeper insights for Prototype Testing. Video recording is browser-based, with no plug in required eliminating setup complexities. Consent to record is captured upfront in the testing process and can be tailored to meet your organization’s policies.
You’ll be able to capture meaningful insights faster and more efficiently with the new Insights feature under our Qualitative Insights (Reframer) tool. Create Insights — takeaways or key findings from a study — and keep them organized under the new Insights tab. Create a new Insight from observations or use AI to generate Insights. Each Insight will contain a title, description, and associated observations.
Note that you and your organization will always maintain complete control over any AI engagement. All AI-generated results are editable. Leverage AI as needed for your studies or decide to turn off access completely for your organization.
We’ll be transforming surveys with enhanced usability, advanced survey logic, and AI integration, empowering you to create, launch, and analyze surveys with ease. Our focus on improving usability will make creating, editing, and launching surveys easier than ever, including new question types, question cloning, question grouping, and AI assistance to streamline survey creation.
We’re looking for customers to join our research and beta panel to help influence product development. From time to time, you’ll be invited to join us for interviews or surveys, and you’ll be rewarded for your time with a thank-you gift.
If you’d like to join the team, email product@optimalworkshop.com.
