Subscribe to OW blog for an instantly better inbox
Oops! Something went wrong while submitting the form.

One of our key priorities in 2024 is making Optimal Workshop easier for large organizations to manage teams and collaborate more effectively on delivering optimal digital experiences. Workspaces is going live this week, which replaces teams, and introduces projects and folders for improved organization and privacy controls. Our latest release lays the foundations to provide more control over managing users, licenses, and user roles in the app in the near future.
Private projects allow greater flexibility on who can see what in your workspace, with the ability to make projects public or private and manage who can access a project. Find out more about how to set up private projects in this help article.
Customers on either a Professional or Team plan will notice the studies tab will now be called Workspace. We have introduced another layer of organization called projects, and there is a new-look sidebar on the left to create projects, folders, and studies.
This new release is an essential step towards improving how we manage users, licenses, and different role types in Optimal Workshop. We hope to deliver more updates, such as the ability to move studies between workspaces, in the near future. If you have any feedback or ideas you want to share on workspaces or Optimal Workshop, please email product@optimalworkshop.com; we'd love to hear from you.

Our exciting new feature, segments, saves time by allowing you to create and save groups of participant responses based on various filters. Think of it as your magic wand to effortlessly organize and scrutinize the wealth of data and insight you collect in your studies. Even more exciting is that the segments are available in all our quantitative study tools, including Optimal Sort, Treejack, Chalkmark, and Questions.
In a nutshell, segments let you effortlessly create and save groups of participants' results based on various filters, saving you and the team time and ensuring you are all on the same page.
A segment represents a demographic within the participants who completed your study. These segments can then be applied to your study results, allowing you to easily view and analyze the results of that specific demographic and spot the hidden trends.
Put simply, you've got a treasure trove of participant data, and you need to be able to slice and dice it in various ways. Segmenting your data will help you dissect and explore your results for deeper and more accurate results.
Question responses: Using a screener survey or pre - or post-study questions with pre-set answers (like multi-choice), you can segment your results based on their responses.
URL tag: If you identify participants using a unique identifier such as a URL tag, you can select these to create segments.
Tree test tasks, card sort categories created, first click test and survey responses: Depending on your study type, you can create a segment to categorize participants based on their response in the study.
Time taken: You can select the time taken filter to view data from those who completed your study in a short space of time. This may highlight some time wasters who speed through and probably haven’t provided you with high-quality responses. On the other hand, it can provide insight into A/B tests for example, it could show you if it’s taking participants of a tree test longer to find a destination in one tree or another.
With this feature, you can save and apply multiple segments to your results, using a combination of AND/OR logic when creating conditions. This means you can get super granular insights from your participants and uncover those gems that might have otherwise remained hidden.
This feature is your go-to when you have results from two or more participant segments. For example, imagine you're running a study involving both teachers and students. You could focus on a segment that gave a specific answer to a particular task, question, or card sort. It allows you to drill down into the nitty-gritty of your data and gain more understanding of your customers.
Let's explore how you can harness the power of segments:
Save time: Create and save segments to ensure everyone on your team is on the same page. With segments, there's no room for costly data interpretation mishaps as everyone is singing from the same hymn book.
Surface hidden trends: Identifying hidden trends or patterns within your study is much easier. With segments, you can zoom in on specific demographics and make insightful, data-driven decisions with confidence.
Organized chaos: No more data overload! With segments, you can organize participant data into meaningful groups, unleashing clarity and efficiency.
Ready to take segments for a spin? To create a new segment or edit an existing one, go to Results > Participants > Segments. Select the ‘Create segment’ button and select the filters you want to use. You can add multiple conditions, and save the segment. To select a segment to apply to your results, click on ‘All included participants’ and select your segment from the drop-down menu. This option will apply to all your results in your study.

We can't wait to see the exciting discoveries you'll make with this powerful tool. Get segmenting, and let us know what you think!

The only tool you need to power your entire qualitative research workflow is here. We’re excited to announce the new and improved Reframer is now live for all customers!
It’s an integral part of any research journey. Think: customer or stakeholder interviews, prototype testing, A/B testing, moderated interviews, and open-ended questions. In a nutshell, it’s anything that isn’t a closed question.
It’s also the most popular research method – 85% of people who do research conduct interviews and usability tests as part of their projects or workflows.

It’s no secret that anyone conducting research is time-poor. Qualitative research is especially time-consuming and messy, as it’s almost always conducted across multiple tools or mediums.
Reframer gives you your time back, and enables you to manage your entire qualitative research workflow within one single tool.
From setting up and conducting interviews, through to analyzing your data – you can uncover those juicy insights in days, not weeks (or months) without ever having to leave the Optimal Workshop app.
Analyzing and making sense of your interview or usability testing data with Reframer is easy and flexible (not to mention very aesthetically pleasing!)
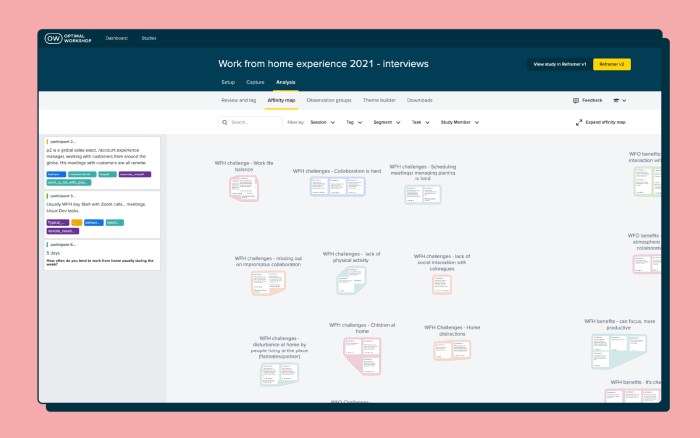
Affinity mapping is a flexible and visual way to quickly group, organize and make sense of qualitative data (i.e. post-its and whiteboards).
With Reframer, affinity mapping is more powerful than ever. Your observations, tags and themes are all connected and stored in one place. It’s easy to search and filter your data, group like observations by proximity, then review and sort them in table format.

The Themes tab offers tag-based analysis with powerful filters. It enables you to explore the relationships between your observations and then create themes based on these relationships. This gives you more quantifiable results to support the qualitative, observation-based analysis that you’ve done in the affinity map.

The chord diagram is a beautifully visual way to easily explore the relationships between your tagged observations and spot key themes.
If you’ve got a lot of tags, it may look a little overwhelming to start with. But don’t let that fool you – it’s easy to get the hang of, and once you do, you’ll wonder how you ever analyzed data without it!

We recommend that you conduct qualitative research as a team, whenever you can. Reframer makes this easy – it was built with collaboration in mind.
On an Optimal Workshop team plan, you can work together from start to finish. Team members can take notes and create or use tags during interview sessions. In the affinity map, you can work collaboratively to group and edit observations in real-time.
If you just need an extra helping hand with taking notes during your interviews or usability tests, you can invite guest notetakers to your sessions. Guest notetakers can take notes in the sessions you invite them to, but can’t see notes taken by others or analyze data.
The guest notetakers feature is a great way to involve your wider team or stakeholders in your user research activities.
Need the raw data from your interviews? Want to share your affinity map visuals with other team members? Both are easily downloadable with the click of a button!

When it comes to conducting qualitative research, Reframer is faster, easier and tidier than using other digital (or manual) tools. It houses all your data and insights in one place and supports the collaborative nature of qualitative research.
It’s not just for seasoned researchers either. We’ve put special focus on ensuring that the analysis is easy to learn for anyone doing qualitative research, regardless of skill level. And our in-app guidance will have you up to speed in no time.
So what are you waiting for? Login now and get started on your Reframer journey!
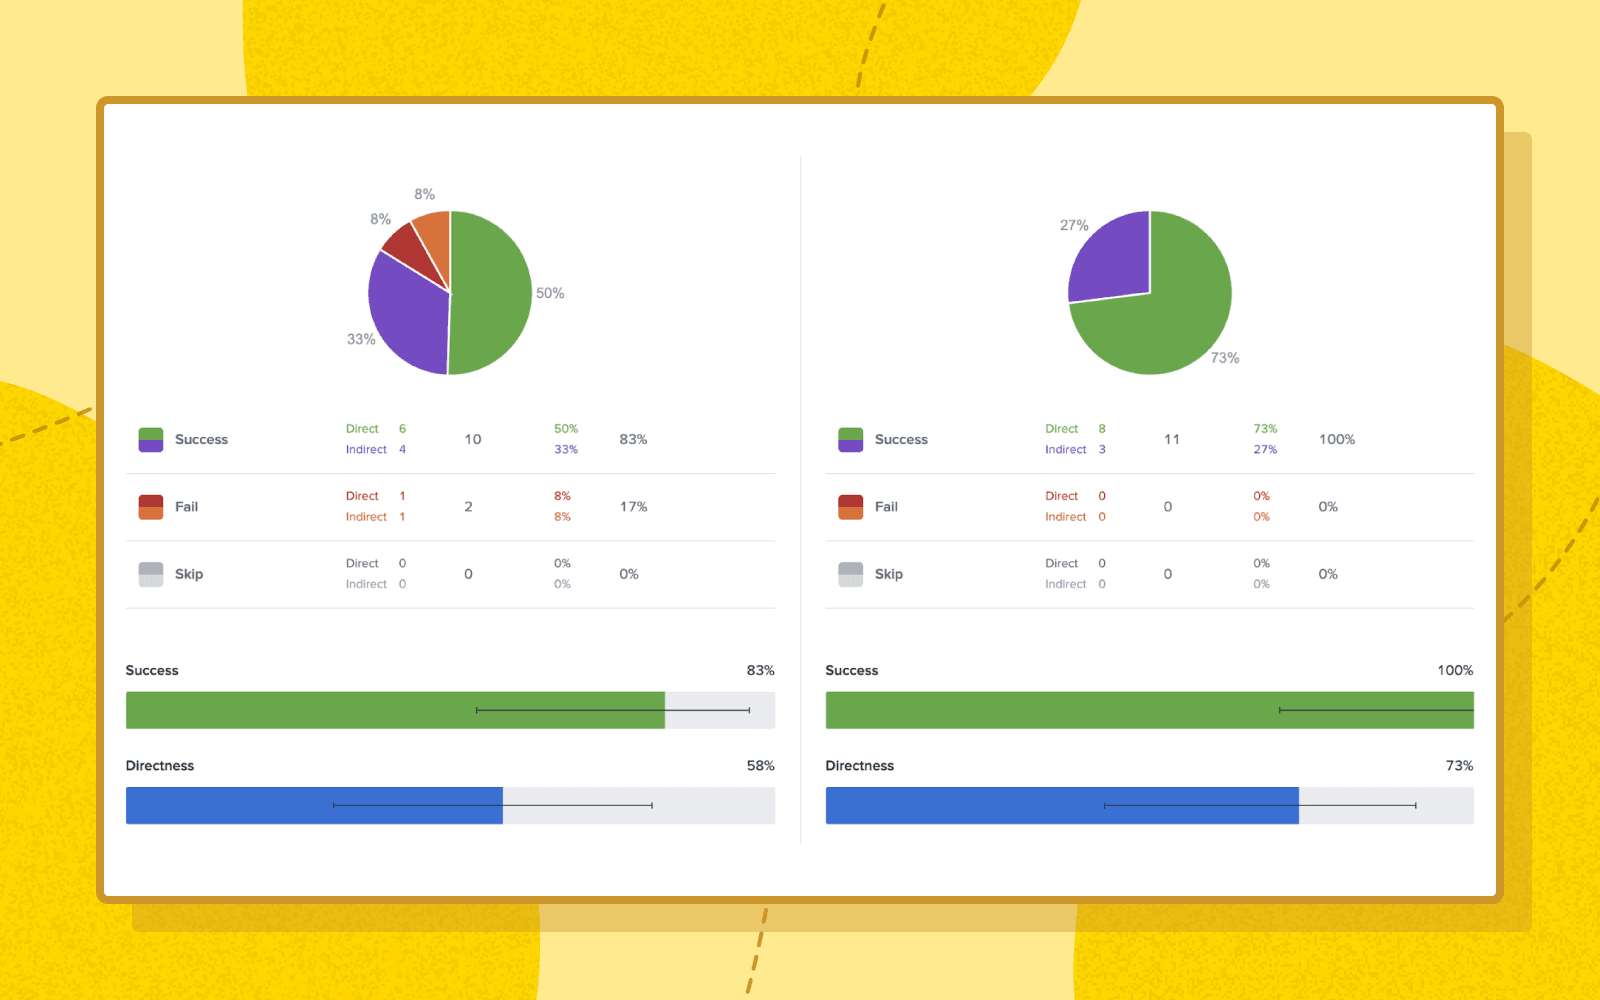
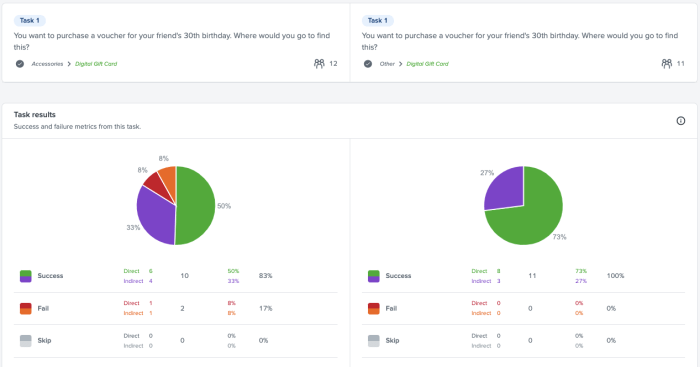
Testing and comparing multiple variations of trees will help you nail down an effective navigation structure before you implement it, saving time and costly mistakes. Treejack's comparison feature allows you to compare two tasks from two different Treejack studies without leaving the results page. It helps make comparing your variations easier and faster by putting results side-by-side for you to explore simultaneously.
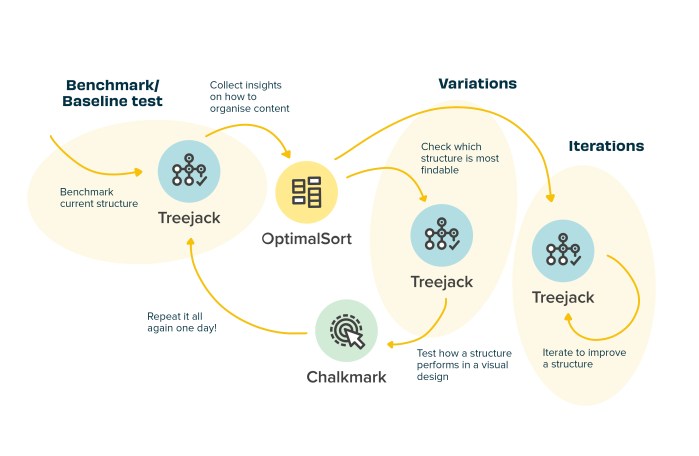
The image above shows a common workflow of how Optimal Workshop tools can be used together to improve your navigation structure.
First things first, sign into your Optimal Workshop account.
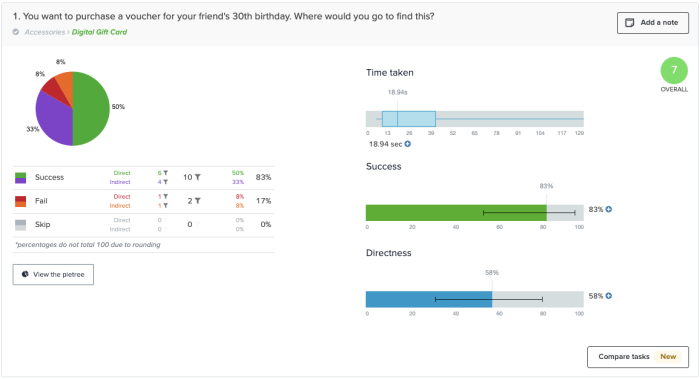
Open the tree test that you want to start your comparison from, then navigate to the Task Results tab in the Analysis section.
Click the ‘compare tasks’ button in your chosen task.
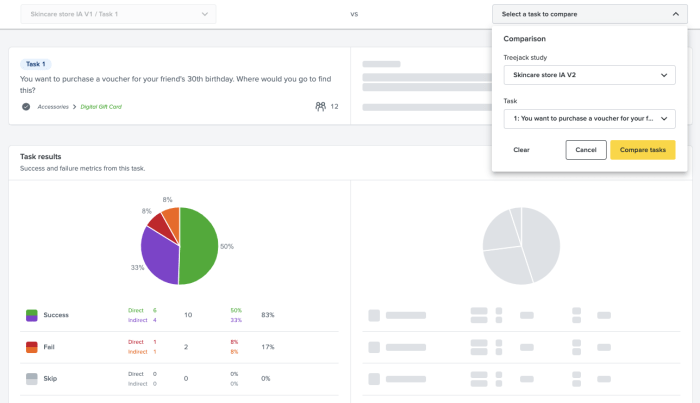
Next select the study and task you want to compare then click 'Compare tasks'.
You can now compare the two tasks together and start the analysis process. Do this as many times, with as many tests and tasks, as you need to.
We’ve got a lot of exciting improvements in the pipeline and as always, we’d love your feedback. You can make feature requests, vote on existing requests and send feedback in Optimal Workshop using the Resource Centre. It's located at the bottom right hand corner of your account, just click the ? icon.
Log in now let us know what you think!

Over the past year, we've been busy getting ready to bring Reframer v2 out of beta. After implementing a ton of feedback from our superb beta users and plenty of usability testing, the day has finally arrived. It's time to say bye-bye beta!
Reframer v2 is a connected, collaborative and flexible workflow for your qualitative research and analysis. It allows you to capture, code, group, visualize and analyze your data within one single tool. And it's now available to all Optimal Workshop customers on a paid plan!
Conducting user interviews or usability tests? Reframer v2 is your new best friend.
To all the Reframer users out there, you'll be chuffed to know that we've taken the best bits of the original tool and added better analysis and collaboration (among other things). We think you'll really enjoy using Reframer v2 (and there's plenty of help to get you up and running in no time).
We made it our mission to alleviate those pesky pain points that so many researchers have when conducting qualitative analysis.
Observations, notes and metadata spread across different tools? No thanks. There's no need for multiple platforms anymore.
Reframer v2 offers an intuitive end-to-end qualitative research workflow within one tool. Create and conduct interview sessions, capture notes, tag, group, theme, analyze, and collaborate without having to leave the app.
With all your juicy data living in different tools, it can be pretty tricky to filter and gain in-depth insight.
Reframer v2 doesn't take a "one size fits all" approach. It's specifically built for qualitative research, with all your metadata and context in one place, all easily searchable with powerful filters.
When you're ready for analysis, you don't want to be stuck doing it one way or the other.
We've added two different analysis methods to Reframer v2. Affinity mapping helps you with observation-based analysis, which is flexible, visual and collaborative. While the Themes tab offers tag-based analysis with powerful filters, giving you more quantifiable results.
Collaboration is key during qualitative research and analysis.
You can work together with your team members in Reframer v2. Simply invite them to your study and any edits or notes they make will show on the affinity map in real-time. You can also see their activity in the Study Members tab.
Reframer v1 will be turned off eventually, and Reframer v2 will simply become Reframer. But we want to make sure that v2 is up to scratch, your data is safe and sound, and you're confident in using v2 before that happens.
Take a look at the next steps of the Reframer v2 release:
Reframer v2 is rolled out to all paid customers. Based on feedback, we'll continue to build in and iterate on the most requested features. Reframer v2 will be the default for all new paid users, but current users can continue to toggle between v1 and v2.
Reframer v2 is rolled out to all customers and is the default for all users. All studies in legacy Reframer will be moved into v2. Paid customers will have access to the full feature set, free users will have access to a limited version of the tool.
Legacy Reframer is turned off and v2 becomes the new (and only) Reframer.

So there you have it! We're really excited to have Reframer v2 in front of all our paid customers, and we can't wait to hear what you think of it. If you've got suggestions or thoughts (good, bad or ugly), we want to know! Simply click the Feedback icon in the header and voila!

Please note: This tool is a work in progress and isn’t yet available to all Optimal Workshop customers. If you’d like to opt in to the beta, pop down to the bottom of this article to find out more.
The ability to collect robust and trustworthy qualitative analysis is a must for any team who conducts user research. But so often, the journey to getting those juicy insights is time-consuming and messy. With so many artefacts – usually spread across multiple platforms and mediums – trying to unearth the insights you set out to get can feel overwhelming.
Since launching Reframer in 2019, we’ve had some great feedback from our users and the community. This feedback has led to the development of the beta version of Reframer v2 – in which we’ve expanded the note taking and tagging capabilities, as well as building a more powerful and flexible analysis functionality: affinity mapping.
Simply put, Reframer v2 is a workflow that houses your data and insights all in one place. Yes, that’s right! No more context switching between various platforms or tabs. It’s an end-to-end qualitative analysis workflow that allows you to capture, code, group and visualize your data.

We’ve put a lot of focus into making sure that the analysis side of things is easy to learn and understand, regardless of your experience level. It’s also more flexible and better suited to qualitative research with data sets both big and small.
The main difference is the analysis workflow. Reframer’s tag-based theme builder has been replaced with an affinity map-based workflow in v2 beta.
The rest of the workflow remains mostly the same, though there are a couple of key differences.
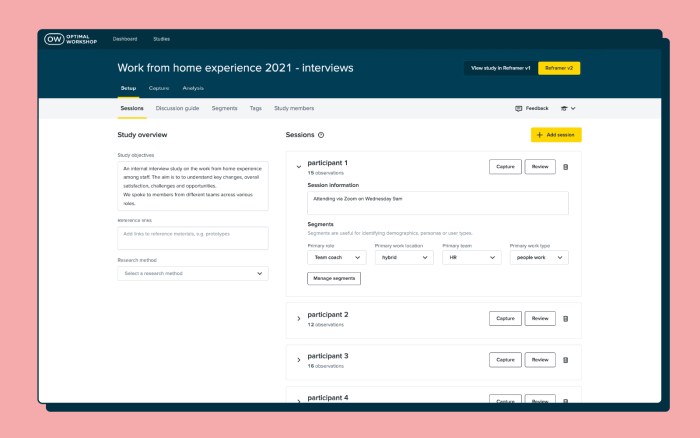
While the activities within the set up and capture phase remain the same, we’ve updated the user interface to better reflect the qualitative research workflow.
All set up related actions (study overview, tasks, tags, segments, and study members) now live together under one tab – ‘Setup’.
You’ll find your sessions and all the observation data you’ve collected in the ‘Sessions’ tab.

For now, we’ve disabled the ability to invite guest notetakers who don’t hold an Optimal Workshop license. That’s not to say this won’t be reintroduced at some stage in the future, though. And of course, your team members who do have a license will be able to collaborate, take notes and analyze data.
The biggest (and the best) difference between Reframer and v2 beta is the analysis workflow. In Reframer, themes are created by combining filters and tags. In Reframer v2 beta, themes are created by grouping observations in the affinity map.

Affinity mapping is a flexible and visual way to quickly group, organize and make sense of qualitative data. It’s a popular method amongst research practitioners of all experience levels, though it’s usually conducted in a standalone tool outside of where the raw data is captured, organized, tagged and stored.
Reframer v2 beta makes affinity mapping more powerful and user-friendly than ever – giving you the ability to search and filter your data, and have your observations, tags, and themes all connected and stored in one place.
It means that Reframer v2 is still very much a work in progress and isn’t yet available to all Optimal Workshop users. We’re continuing to develop new functionality that will complete the qualitative data analysis workflow and, if you’re part of the beta, you can expect to see new features and changes being rolled out in the coming months.
There may be a few bugs along the way, and we know the current name doesn’t exactly roll off the tongue so standby for a rebrand of the tool name once it’s ready for general consumption!
Want to help us make Reframer v2 beta really, really great? We’d love that. We here at Optimal Workshop rely on your thoughts, opinions and feedback to build and update our tools so they benefit those who matter most: you.
If you’d like to opt into the beta, sign up here.
And if you’d like to get down into the nitty gritty about the what, why and how of Reframer v2 beta, check out our Help Center articles here.
