Subscribe to OW blog for an instantly better inbox
Oops! Something went wrong while submitting the form.
Articles and Podcasts on Customer Service, AI and Automation, Product, and more
The pace of product development has never been faster, and the cost of building on assumptions has never been higher. At Optimal, we've spent nearly two decades helping teams get closer to their users, and what we're seeing right now is a fundamental shift in how research gets done. More teams are running research than ever before and timelines to act on findings are tighter, while the expectations for what research needs to deliver keep rising.
That shift is exactly what's driving Optimal 3.0, our most ambitious reinvention of the platform yet, designed to give every team the speed, depth, and flexibility that modern research demands. Today's release is the next step in that journey.
Optimal's new mixed-methods research tool tears down the boundaries between methods. It brings prototype testing, live site testing, and surveys into a single, end-to-end study workflow. And grounded in our product principles: speed to insights, access for all, and communication.
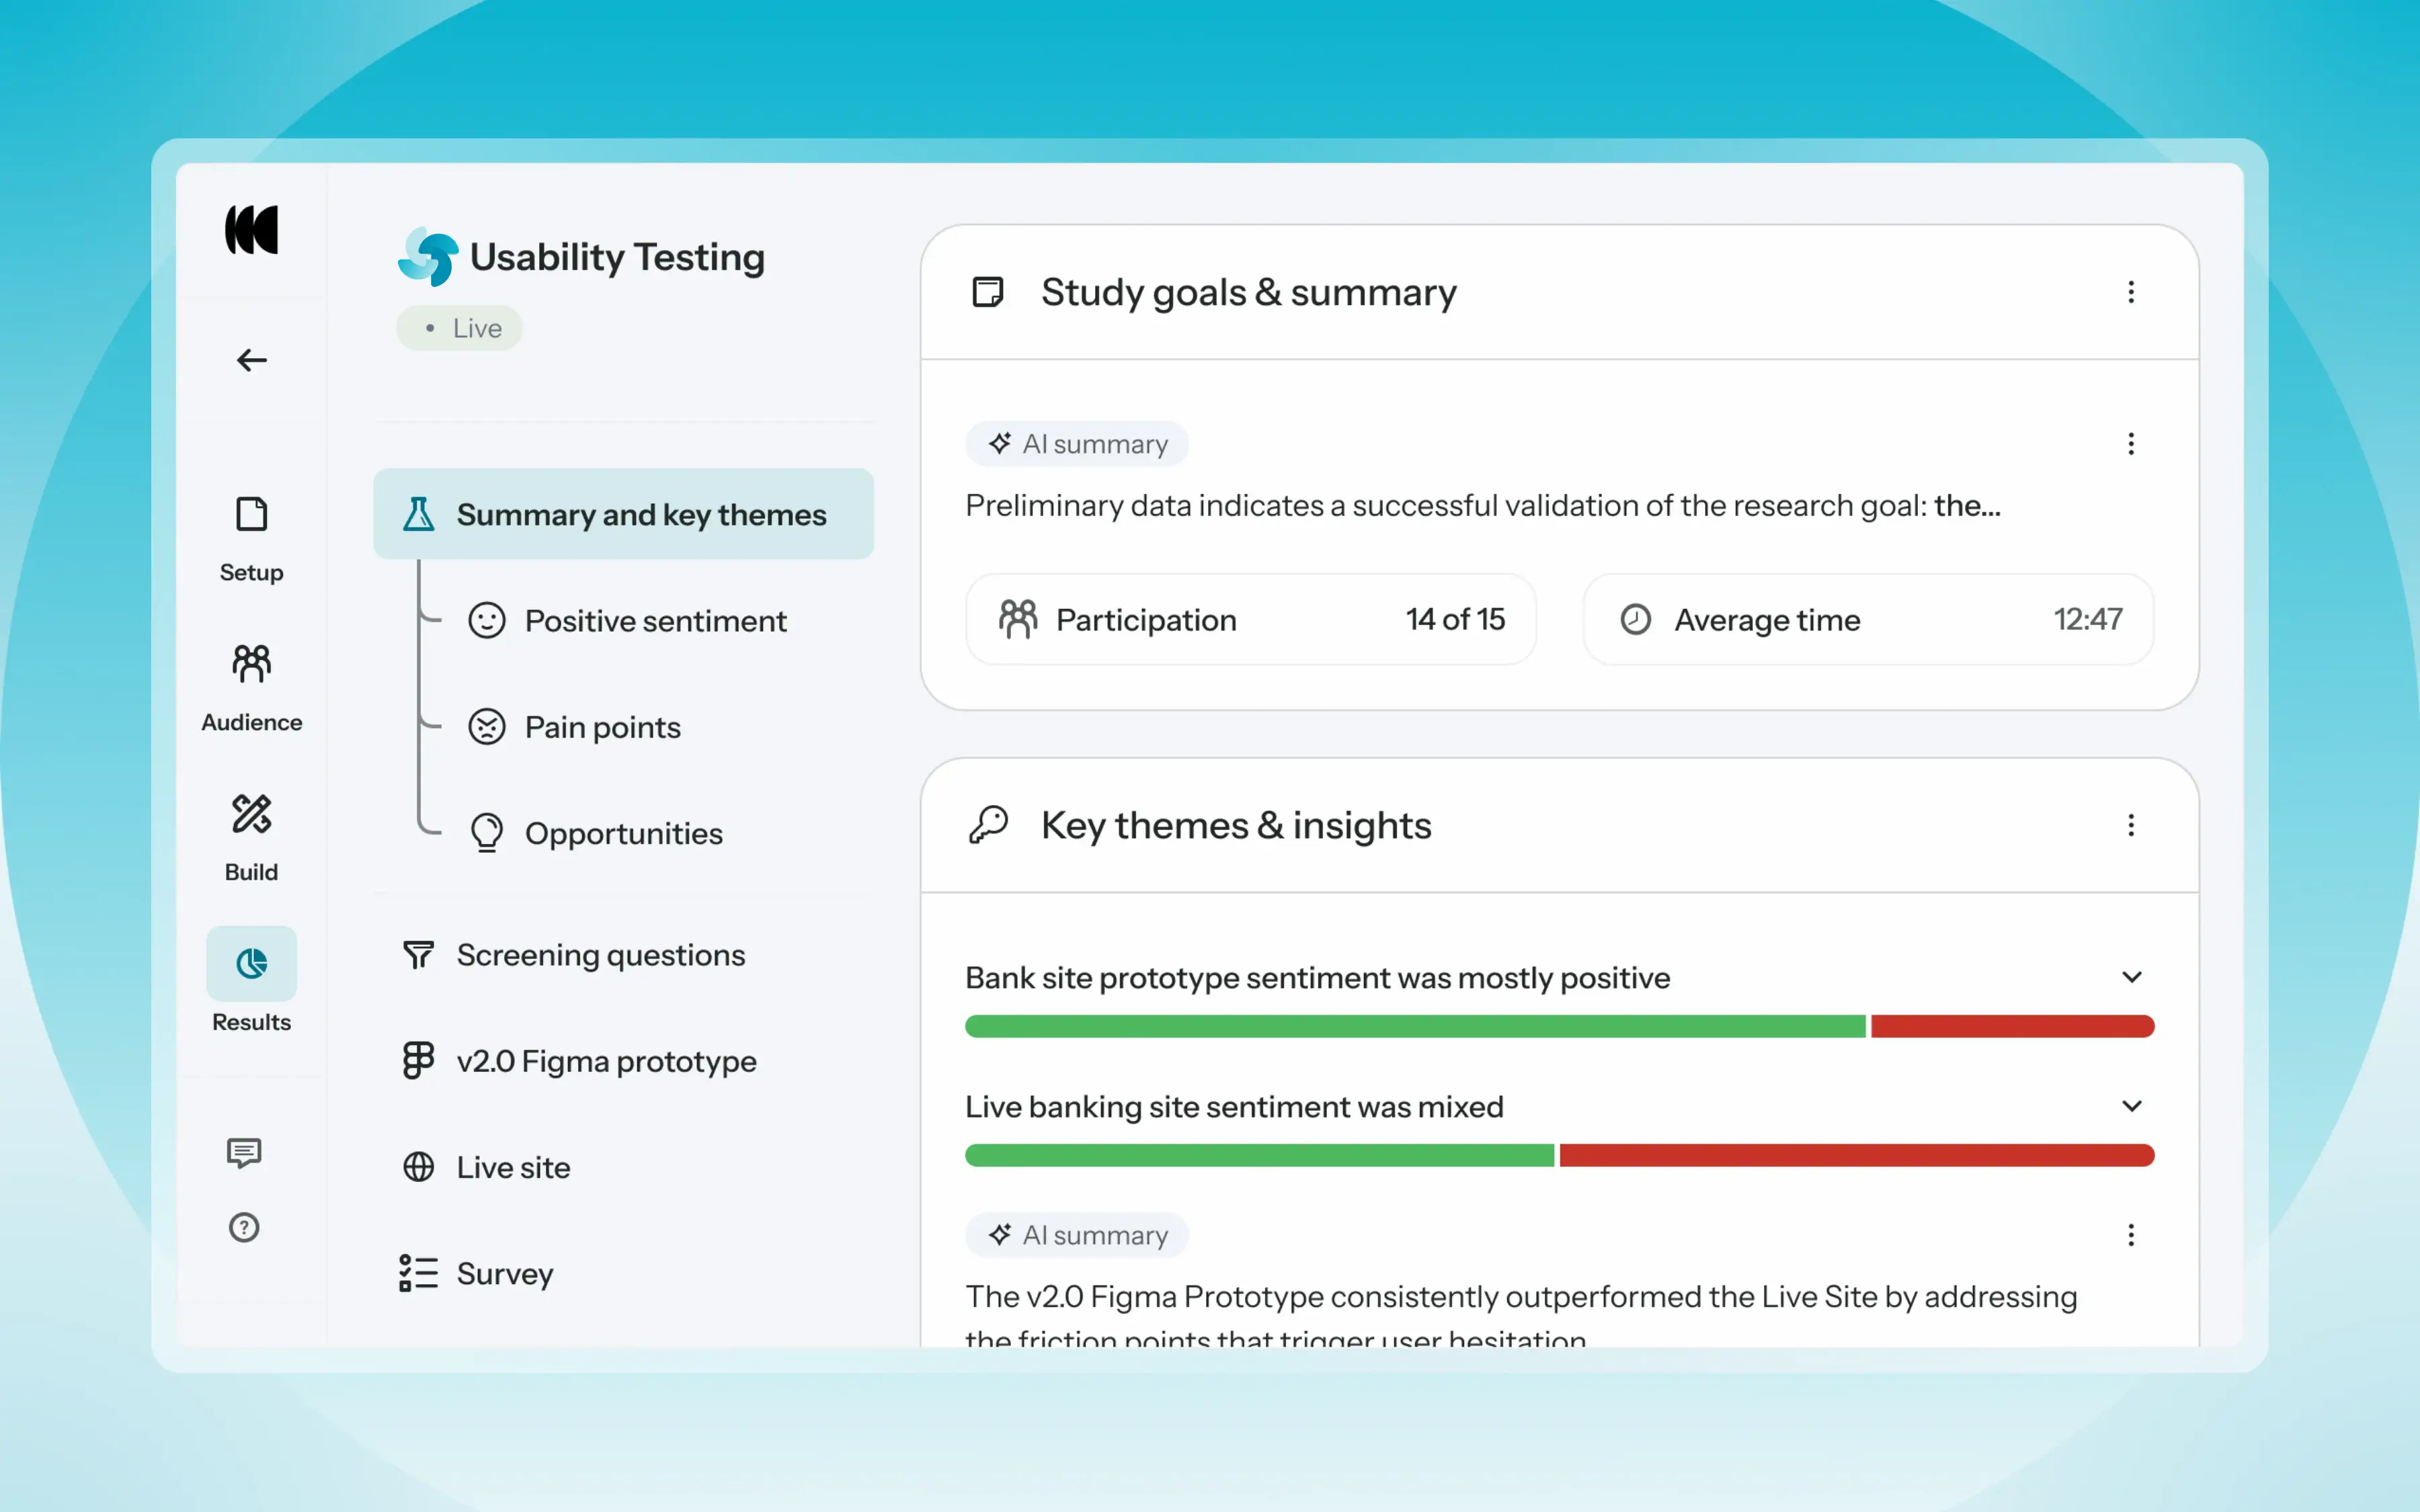
Optimal’s new Usability Testing tool marks the next step in the evolution of Optimal 3.0, giving teams the flexibility to evaluate experiences in whatever form they exist today.
Combine prototype testing, AI prototype testing, live site testing, and surveys in a single study. Test multiple prototypes side by side, compare different live URLs, or mix prototype and live site tasks together all in one workflow. Research can now mirror how products actually evolve, from early concept to shipped experience.
New speak-aloud question types, custom message blocks, auto-generated transcripts and insights, citations and highlight clips help you capture the context and reasoning behind every action. AI-assisted analysis then helps you make sense of it all fast and communicate with impact.
Review a study overview surfacing key themes, pain points, and sentiment analysis combining insights across all your study methods along with detailed results, task analysis and recordings, transcripts, key quotes, and automatically generated citations and video clips.
Coming soon: you can also use AI Chat to chat with your data directly, asking questions and pulling new insights and evidence across all your qualitative and quantitative inputs.
Modern product development is no longer linear. Teams continuously move between:
Traditional usability testing tools were not built for this fluidity. Optimal’s Usability Testing brings the flexibility to match how teams actually work today.
By combining multiple methods into a single study and pairing it with AI-powered synthesis, Usability Testing helps teams reduce setup and analysis time, recruit once, capture richer qualitative context, compare experiences more easily, move faster from feedback to action, and tell clearer, more compelling insight stories.
Learn how to get started with Usability Testing in Optimal and accelerate your path from idea to insight. Book a meeting, start exploring in your account, or join our live training webinar on June 24th to see it in action.
Understanding your customers is central to any organization which wants to deliver an outstanding experience. But how do you understand your customers better? Tailoring their experience with your products and your organization to suit them should include a customer journey map.
It doesn’t mean your organization needs a brightly colored, fully designed infographic that outlines each and every action your user takes within your product. It does mean an effective customer journey map that promotes empathy and provides a clear vision for improving customer interactions. There are no rules around what that visualization looks like and it is up to your team to create one that makes the most of your customer’s journey.
Customer journey mapping (sometimes referred to as a user experience map) is a technique that allows you to visualize your customer’s key touchpoints, sentiments, pain points, and actions. Plotted in sequential order. It’s a map of a customer’s experience with your brand or product, from awareness to purchase and beyond.
Customer journey mapping helps you look beyond key touchpoints and encourages empathy with your customers. To understand who they are, even a persona to give them a life and demographic. Helping designers and key stakeholders understand where they are coming from. And where you can address their needs, avoid their pain points and encourage them to engage with your product. And even identify opportunities for innovation and improvement across the board.
What’s better than a customer that feels seen and understood once? A customer that feels the organization or product really understands their needs (and responds to their frustrations). Like all successful, long-term relationships, keeping customers returning is built on empathy and a solid grasp of their needs and frustrations.
When you want to get to know your customer, like really get to know them, it’s essential to map their customer journey. Creating a shared understanding of what your customers think, feel, and struggle with as they interact with your organization. Spending the time to establish a customer journey map can help align around identifying known problems, identifying new user pain points, and removing roadblocks for your customers, ensuring their success.
Spending the time to get inside the mind and journeys of your customers through mapping helps your team to:
Here are 8 key steps to get the most out of your customer journey map process:
Each and every customer’s journey is different. This, of course, means that there is no single best customer journey map example or template. Instead, the best customer journey map for any given situation will depend not only on your customers but also on your product, your team, and the goals you’re hoping to achieve by creating the map in the first place.
We’ve found a few examples of customer journey maps to help inspire your thinking:
Current state customer journey maps help you to visualize a user’s experience as it is right now. These are fact-based journey maps - to create an accurate, current state journey map. A good dose of user research data around your actual customers and interactions will help shape this.

Future state customer journey maps focus on what the customer journey can and should look like in the future. Although UX data is certainly an important aspect of understanding customers, future state journey maps involve a fair amount of creative speculation and interpretation. These customer journey maps focus on customer hopes and wants (future feelings), in addition to experiences and reactions. They can be a little objective and should be developed in balance with both positive and negative interactions.
Day in the life customer journey maps help you visualize your customer’s entire daily routine. Interactions with family, their commute, work meetings, afternoon coffee, etc. Regardless of whether or not the activities are related to your company. This type of journey map should be organized chronologically to give key insights into how and where customers are. What are the distractions, and where could they interact with your brand or product? How can key pain points be eased?
Service blueprints are a useful counterpart to a classic customer journey map. Whereas a customer journey map focuses on the thoughts, needs, and actions of the customer, a service blueprint reflects the perspective of the organization and its employees. What needs to happen behind the scenes to ensure the customer’s experience is the very best it can be.
Circular customer journey maps may be useful to visualize the customer journey as a circle or loop. Recognizing that some customers are recurring and non-transactional. Particularly through subscription-based relationships.
An empathy map is used to create a shared understanding of customers around their wants, needs, thoughts, and actions. This can be a great starting point to getting under your customer’s skin.

There is no one size fits all customer journey map. Each customer is unique, each organization is different. Through creating customer journeys, personas and visualizing their key touchpoints, pain points, and understanding who they are, empathy throughout the organization can be generated. With this as a tool to bring key stakeholders on board and to pinpoint where products (and services) can be improved to keep customers or even bring new ones on board, the user experience can be better and more effective.

During the design process information architecture is often carried out by an information architect and/or a team of UX designers, developers, and other professionals. As a content professional, it’s best not to stand at arm’s length. It's important to understand the basics of information architecture and how it impacts your content strategy and user experience.
Information architecture (IA) is the system and structure designed to organize and label content on your website, app, or product. It is often visualized through wireframes, spreadsheets, and diagrams. It is the way the content is ordered as well as the labels given to the content, and the differing pieces of information. The IA is created with this knowledge as well as an understanding of the product owner’s intentions and the user’s requirements.
Put simply information architecture looks at the organization, labeling, navigation, and search for supporting usability, functionality, and findability.
When designing IA, it is important to consider questions such as:
When it comes to content strategy, it can be equally important to focus on the taxonomy of the content. But what is taxonomy? Taxonomy refers to how information is grouped, classified, and labeled within a shared information environment. The overarching structure of that shared information environment is the information architecture (IA) which we find our way around using navigation.
With this understanding, the content strategy looks at what the needs of the organization are, the desires of the users (what are they looking for), and what sits in between. Using a strong, logical, and intuitive taxonomy structure will knit these needs together in a way that makes sense.
Content architecture, if you like, is the umbrella term used for encompassing the way that content is organized, structured, labeled, and linked together. Effective content architecture is essential to creating a great content management experience for editors, content managers, and content strategists who need to load, manage and organize the content on an ongoing basis. More importantly, solid content architecture is essential to creating a positive user experience for those consuming the content.
Focusing on creating content architecture that works will benefit your organization by increasing your content team’s agility and empowering them to rely less on developers to find and organize content. When the content team has a clean and easy-to-navigate backend of a website, it benefits the front end as the team can easily grow the content on its front end over time.
Effective, thought-through information architecture is the backbone of a well-designed website. When developing a website considering how it is used (internally and externally), the content strategy, and how it can function for both sides is vital.
With an understanding of how the content is organized, labeled, and navigable, the content strategy can play a big part in informing this and vice versa. Developing a content taxonomy that makes searching and finding content intuitive can improve the user experience. Not only that, a content strategy that works with the established taxonomy can show up gaps in content. Possibly showing where there is space for more content that speaks to what users want to see. Delivering great content, well organized and easy to find.
Content strategy shouldn’t only be thought about once the website is built - it should also be considered at the beginning of the development. Why? As the organization evolves and grows, so will the content strategy. With a well-established content taxonomy, the IA can be tweaked and worked as things change. Just as much as the content strategy is changing, the information architecture should also.
And never forget that information architecture isn’t only about what the end users need, effective IA creates a back end that is simple to use, load, tag, and sort for the content team. Keeping the website up to date, content frequently updated and added to. Easing the flow of great content delivered to users. Everyone is happy!
Content strategists and information architects aren’t miles apart. Each is working to make the very best website for the end user. Information architecture uses taxonomy to make order of the information, where content strategy can drive this taxonomy, helping to label, name, tag and order the content in a way that makes sense to the user and the website owner. And even to preempt what might be needed in the future.

Information architecture is so much more than finding your way around a website or app. IA should be considered the foundation of a great user experience. The planning and consideration that goes into how information is organized labeled, and named. Once this foundation is laid, the user interface is what sits above and allows users to access the information. Navigation is one way that designers can point users in the right direction. But without correct labeling and naming (or even searching) navigation can only get us part of the way.
Let’s go into detail about what information architecture and the role navigation really plays.
Probably the easiest example of navigation is on a website. We are familiar with websites and how navigation can make or break a user experience. A website's information architecture (IA) can be considered to be made of two main components:
When a user lands on your website they won’t see the information architecture, rather, they will be interacting with the user interface (UI). While the IA itself is not visible while using the user interface it most certainly impacts the user's experience (UX).
The IA should be planned and the content structure visualized through diagrams, spreadsheets, and with wireframes, prototypes, or comprehensive layouts. Designing with the IA in mind web designers can create a better user experience. The user will not see the structure of the website but they will quickly discover the way the content has been divided up and then connected visually. And how well the information architecture matches these expectations will influence their UX.
When this interaction is not a great experience, users may leave feeling that your website content or functionality is not what they needed. They may end up feeling disappointed with the experience due to poor organization, naming, or structure.
Ensuring that the information architecture is thought through, considered from the end users’ perspective, tested, and planned is essential to building a great website from the ground up. Great navigation is what cues users to move on to the next step in their journey and ultimately will determine their experience.
Navigation is but one part of the story and tools to help users find their way through a website, app, or other product.
Information architecture can be broken down into three main areas to consider when building a great user experience:
When put like this it does seem pretty straightforward. Information architecture isn’t just how your information is navigated (on a website or app) but how it is labeled, the taxonomy, and the searchability help users find what they need from the information architecture.
An information architecture that has been planned, considered, researched, and structured with understanding and the intention of the needs of users and the owners will be robust and at its very best intuitive.
With an information architecture that has been organized well the navigation doesn’t need to work as hard. With correct labeling and organization of the content, navigation acts as a visual guide on your product to help users find their way to what they want. Imagine well-named road signs that are expected and easily seen. It makes finding what (where) you want much easier, even on a dark night.
Coupled with robust IA navigation will provide intuitive pathways for users to complete tasks. For instance, if you want your users to find where your contact information is, making certain that there is a navigation tab at the top of your website labeled ‘contact us’ which then has what might be expected (address, phone number, map, and even an email contact form) will make sense for users and the owners of the website.
Whilst navigation is a key component to users finding their way through your content information architecture is so much more than navigation. IA is the foundation of a great product, naming, labeling, organizing, and planning your information in a logical and expected way. Navigation is the sign that directs people to the content they want. And from there to the task or product they are looking for. If there is navigation without thought through information architecture, they may look in the wrong place, becoming lost and abandoning their task altogether.
We all know that building a robust information architecture (IA) can make or break your product. And getting it right can rely on robust user research. Especially when it comes to creating human-centered, intuitive products that deliver outstanding user experiences.
But what are the best methods to test your information architecture? To make sure that your focus is on building an information architecture that is truly based on what your users want, and need.
With all the will in the world, your product (or website or mobile app) may work perfectly and be as intuitive as possible. But, if it is only built on information from your internal organizational perspective, it may not measure up in the eyes of your user. Often, organizations make major design decisions without fully considering their users. User research (UX) backs up decisions with data, helping to make sure that design decisions are strategic decisions.
Testing your information architecture can also help establish the structure for a better product from the ground up. And ultimately, the performance of your product. User experience research focuses your design on understanding your user expectations, behaviors, needs, and motivations. It is an essential part of creating, building, and maintaining great products.
Taking the time to understand your users through research can be incredibly rewarding with the insights and data-backed information that can alter your product for the better. But what are the key user research methods for your information architecture? Let’s take a look.
There is more than one way to test your IA. And testing with one method is good, but with more than one is even better. And, of course, the more often you test, especially when there are major additions or changes, you can tweak and update your IA to improve and delight your user’s experience.
Card sorting is a user research method that allows you to discover how users understand and categorize information. It’s particularly useful when you are starting the planning process of your information architecture or at any stage you notice issues or are making changes. Putting the power into your users’ hands and asking how they would intuitively sort the information. In a card sort, participants sort cards containing different items into labeled groups. You can use the results of a card sort to figure out how to group and label the information in a way that makes the most sense to your audience.
There are a number of techniques and methods that can be applied to a card sort. Take a look here if you’d like to know more.
Card sorting has many applications. It’s as useful for figuring out how content should be grouped on a website or in an app as it is for figuring out how to arrange the items in a retail store.You can also run a card sort in person, using physical cards, or remotely with online tools such as OptimalSort.
Taking a look at your information architecture from the other side can also be valuable. Tree testing is a usability method for evaluating the findability of topics on a product. Testing is done on a simplified text version of your site structure without the influence of navigation aids and visual design.
Tree testing tells you how easily people can find information on your product and exactly where people get lost. Your users rely on your information architecture – how you label and organize your content – to get things done.
Tree testing can answer questions like:
Treejack is our tree testing tool and is designed to make it easy to test your information architecture. Running a tree test isn’t actually that difficult, especially if you’re using the right tool. You’ll learn how to set useful objectives, how to build your tree, write your tasks, recruit participants, and measure results.
If you are wanting a fully rounded view of your information architecture, it can be useful to combine your research methods.
Tree testing and card sorting, along with usability testing, can give you insights into your users and audience. How do they think? How do they find their way through your product? And how do they want to see things labeled, organized, and sorted?
If you want to get fully into the comparison of tree testing and card sorting, take a look at our article here, which compares the options and explains which is best and when.
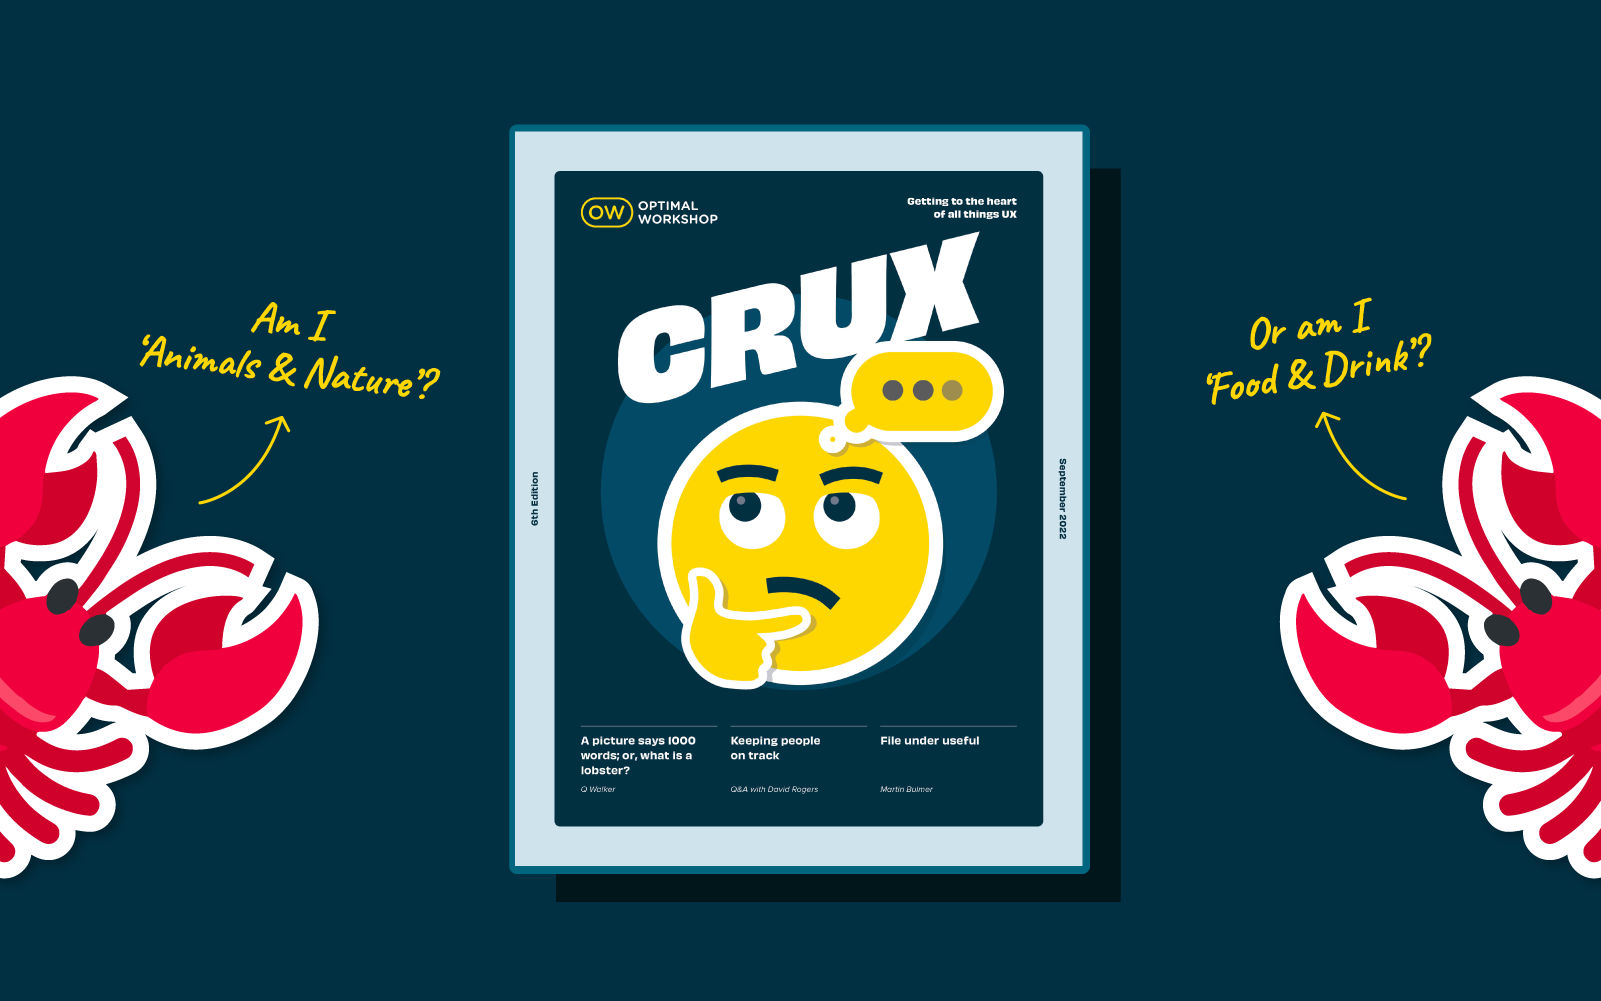
According to Abby Covert, author, teacher and community leader in the field of information architecture (IA) : ‘IA is the way we arrange pieces of content to make sense when experienced as a whole. By this definition: there is information architecture in everything. Mindblown?’
😮 (That’s a resounding yes from an IA rookie like me.)
In this issue of CRUX we go in search of information architecture and have some surprising encounters in the worlds of emoji, elevators, walking tracks, games and more. We meet UX designers, developers, researchers and even a Senior Park Ranger. It seems you can have your ‘IA hat’ on without even realising it. That’s the power of information architecture.
The stories and people in this issue of CRUX certainly captured our imagination and attention - we hope they inspire and even surprise you too.
Get comfortable and settle in for a great read. Welcome to CRUX #6.
Do you have a burning idea to share or a conversation you’re dying to kickstart that’s of interest to the world of UX? Now’s your chance. We’re already on the lookout for contributors for our next edition of CRUX for 2022. To find out more please drop us a line.

We've launched a brand new series of 'bite sized' presentations to make your lunch break more inspiring. Together with speakers, community groups, and organizations from around the world — these virtual events dive into a variety of topics impacting our industry today.
Join us at the end of every month for Lunch n' Learn.
Sign up now to stay in the loop.
In our first Lunch n Learn, Clara Kliman- Silver, Senior UX Researcher at Google unpacked some of the barriers to effective designer-developer collaboration.
In her talk "UX in a distributed world", Clara discussed various workflow stages, the role of design systems, common pain points, and mitigation strategies — all based on UX research studies with designers, developers, and product teams over the last three years.
Clara also covered research on UX tools, how tools have transformed workflows, and where a perceived tooling problem might actually be a process issue (and what you can do about it). In addition, she considered how tools and workflows might evolve in the future.
https://www.youtube.com/watch?v=x4sYWOdROBM
📹: UX in a distributed world.
Clara Kliman-Silver is a Senior UX Researcher at Google who studies design teams, design systems, UX tools, and designer-developer collaboration.
She specializes in participatory design and generative methods to investigate workflows, understand designer-developer experiences, and imagine ways to create UIs.
In previous roles, she has conducted research on developer tools, artificial intelligence, and healthcare. Clara holds a Bachelors of Science in Cognitive Science from Brown University.
Grab your lunch, invite your colleagues, and we hope to see you at the next Lunch n' Learn.
