In 2009, Bob Bailey and Cari Wolfson published published findings that changed how we approach first click testing and usability testing. They analyzed 12 scenario-based user tests and found that if someone gets their first click right, they're about twice as likely to complete their task successfully. This finding was so compelling that we built First Click Testing (formerly Chalkmark) specifically to help teams test this. But we'd never actually validated their research using our own data, until now.
Turns out, we're sitting on one of the world's largest databases of tree testing results. So we analyzed millions of task responses to see if the "first click predicts success" hypothesis holds up.
It does. Convincingly.
Users who get their first click correct are nearly three times more likely to complete their task successfully (70% vs 24% success rate).
Here's how we validated the original study, what our data shows, and why first clicks matter more than you might think.
Original first click testing study: 87% task success rate
Bob and Cari analyzed data from twelve usability studies on websites and products with varying amounts and types of content, a range of subject matter complexity, and distinct user interfaces. They found that people were about twice as likely to complete a task successfully if they got their first click right, than if they got it wrong:
If the first click was correct, the chances of getting the entire scenario correct was 87% if the first click was incorrect, the chances of eventually getting the scenario correct was only 46%.
Our Tree Testing data: First clicks predict 70% task success rate
We analyzed millions of tree testing responses in our database. We've found that people who get the first click correct are almost three times as likely to complete a task successfully:
If the first click was correct, the chances of getting the entire scenario correct was 70% if the first click was incorrect, the chances of eventually getting the scenario correct was 24%
To give you another perspective on the same data, here's the inverse:
If the first click was correct, the chances of getting the entire scenario incorrect was 30% if the first click was incorrect, the chances of getting the whole scenario incorrect was 76%
How Tree Testing measures first click success and task completion
Bob and Cari proved the usefulness of the methodology by linking two key metrics in scenario-based usability studies: first clicks and task success. First Click Testing doesn't measure task success — it's up to the researcher to determine as they're setting up the study what constitutes 'success', and then to interpret the results accordingly. Tree Testing (formerly Treejack) does measure task success — and first clicks.
In a tree test, participants are asked to complete a task by clicking though a text-only version of a website hierarchy, and then clicking 'I'd find it here' when they've chosen an answer. Each task in a tree test has a pre-determined correct answer — as was the case in Bob and Cari's usability studies — and every click is recorded, so we can see participant paths in detail.
Thus, every single time a person completes an individual tree testing task, we record both their first click and whether they are successful or not. When we came to test the 'correct first click leads to task success' hypothesis, we could therefore mine data from millions of task.
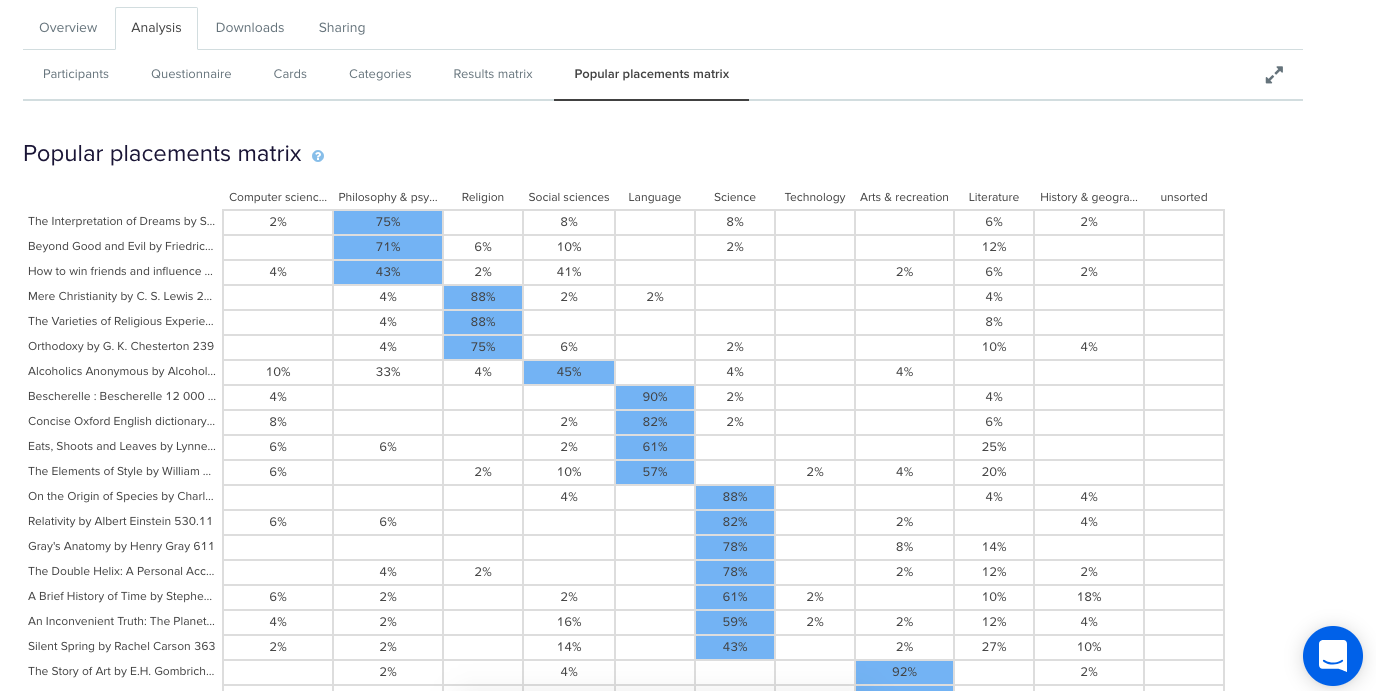
To illustrate this, have a look at the results for one task. The overall Task result, you see a score for success and directness, and a breakdown of whether each Success, Fail, or Skip was direct (they went straight to an answer), or indirect (they went back up the tree before they selected an answer):

In the pie tree for the same task, you can look in more detail at how many people went the wrong way from a label (each label representing one page of your website):

In the First Click tab, you get a percentage breakdown of which label people clicked first to complete the task:

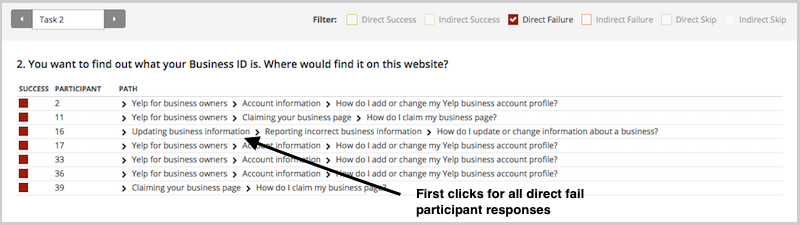
And in the Paths tab, you can view individual participant paths in detail (including first clicks), and can filter the table by direct and indirect success, fails, and skips (this table is only displaying direct success and direct fail paths):
How to run first click tests: Best practices for usability testing
First click analysis is one of the most predictive metrics in usability testing. Whether you're testing wireframes, landing pages, or information architecture, measuring first click success gives you early insight into whether your design will work.
This analysis reinforces something we already knew: first clicks matter. It is worth your time to get that first impression right. You have plenty of options for measuring the link between first clicks and task success in your scenario-based usability tests. From simply noting where your participants go during observations, to gathering quantitative first click data via online tools, you'll win either way. And if you want quantitative first click data, Optimal has you covered. First Click Testing works for wireframes and landing pages, while Tree Testing validates your information architecture.
To finish, here are a few invaluable insights from other researchers on getting the most from first click testing:
- Jeff Sauro details a useful approach to running a first click test, and shares the findings from a test he ran on 13 people.
- An article on Neoinsight describes three common usability problems that first click testing can solve.
- Gianna LaPin describes a first click test she ran on Netflix, VUDU, and Hulu Plus.
About this study
This analysis was conducted in 2015 using millions of task responses from Optimal’s First Click and Tree Testing tools. While the dataset predates recent UI trends, the underlying behavioral principle, that a correct first click strongly predicts task success, remains consistent with modern usability research.