January 10, 2022

How to develop a taxonomy for your information architecture

When I first heard the word ‘taxonomy’, I had no idea what it meant. I remember enthusiastically nodding my head at my boss about how awesome it is while frantically Googling it under the table. We’ve all been there early on in our careers. Although, what I found left me feeling even more confused — something about classifying animals? Whether you’re as confused as I was all those years ago or just in need of a refresher, this quick guide to all things taxonomy will sort you out.

What is a taxonomy in information architecture?

In information architecture, taxonomy refers to how information is grouped, classified and labeled within a shared information environment. The overarching structure of that shared information environment is the information architecture (IA) and we find our way around it using the navigation. Think of an IA as a house. The taxonomy determines which pieces of furniture belong in each room and we navigate around the house via doorways and hallways. It all fits together to create one shared environment.

For a website architecture example, think of an online shoe store. The shoes might be organized and labelled by color, size, style, season or collection — that’s the taxonomy. The overall picture of where those groups of shoes live is the IA and in our pursuit of new shoes, we might navigate that structure via a navigation bar at the top of the page. In the amazing Grand Taxonomy of Rap Names visualization below, we can see how the information is categorized, connected and labeled through the lines and the colors. There’s no structure or hierarchy to it yet; that would be the next step in the process to build the IA.

A taxonomy visualization of rapper names
Source:http://hiphopmakers.com/grand-taxonomy-of-rap-names

Creating a taxonomy

There are so many different ways to carve information up into a taxonomy and the key drivers for determining that are your content and, of course, your users. Your taxonomy needs to make sense to your users.You may be starting from scratch with a new website or you may have inherited a taxonomy that for whatever reason just isn’t fit for purpose. The first step when creating an initial taxonomy is to do a comprehensive audit of your content. Ask yourself, is your content relevant? Is it up-to-date? Is it all necessary? Are there opportunities to delete or condense content? Once you have your content sorted, you’re ready to move on to the next step of running a card sort with users.Running a card sort early in your taxonomy creation process will allow you to build it up from an evidence based foundation. There’s no point guessing then testing and potentially going back to square one, when you can co-create with your users and then test that informed approach to validate and further evolve your thinking.When you’re designing your card sort, you’ll need to decide if you’re going to do an open, closed or hybrid sort. Here’s a very high level look at what each type involves:

  • Open: participants sort cards into groups and name their own categories
  • Closed: participants sort cards into categories determined by you
  • Hybrid: participants sort cards into categories determined by you AND they can also make up their own.

This early in the taxonomy creation process, it’s best to start out with an open card sort. Not only will this tell you how your users expect your content to be grouped, but will also provide insight into the language and labels that they would expect that content to be associated with. You never know, an open card sort may even surface something you hadn’t considered. At this stage of the process, it’s important to be open to ideas and new possibilities and an open card sort will do just that.Once you’ve settled on the type of card sort you’ll be running, you’ll need to test which can be done through a tool such as Optimal Workshop’s OptimalSort. OptimalSort enables you to run unmoderated card sorts remotely (or print out cards for a moderated/in-person card sort!). After your participants have completed your card sort, you can access the benefits of OptimalSort’s powerful result analysis functions.

Learn more about running a card sort and more through our 101 guide.

After you’ve run your initial open card sort with users, you should have everything you need to create the first iteration of your taxonomy. Consider everything you learned during the card sort and cross reference that with your business goals and any tech constraints you might be facing. Don’t stress too much about nailing it this time around — remember this is the first iteration and as you test more and learn more, you can make changes. Build out your taxonomy in Post-it notes with a team and then whack it into a spreadsheet to make future testing and iteration activities easier.

How to test a taxonomy

Now that you have the first iteration of your taxonomy, it’s time to have a go at structuring those groups into an IA and running a tree test. A tree test works like a card sort but in reverse — it allows you to test your thinking by working backwards. Optimal Workshop’s Treejack is an online tree testing tool that helps you assess the findability of your content without any visual design elements. All you need are clear objectives for what you’d like to learn more about and a spreadsheet version of your draft IA (told you it would come in handy! ).

Learn more about Treejack and tree testing through our equally handy 101 guide.

Another way to test your taxonomy thinking is to run another card sort. However this time, a hybrid or a closed card sort might be more suitable. A closed card sort would be useful if you’ve got evidence to suggest that your group labels are making sense to users but you’re not 100% sure what belongs in each group. A hybrid sort will let you go one step further and tell you if your content does in fact fit within those labels and if not you’ll also pick up some new ideas to iterate your taxonomy further.

Developing a taxonomy is like any other design process. Bring users into your process as early as you can and never stop iterating, improving and learning.Oh, and about those animals — I wasn’t entirely wrong. The way we classify animals (e.g., vertebrates and invertebrates) is a taxonomy. There are taxonomies everywhere and they’re not all digital. From libraries to supermarkets, we are immersed in taxonomies. It's the role of information architects to determine how these taxonomies are presented to us and how we navigate through them — the possibilities are truly endless!

Further reading

Share this article
Author
Optimal
Workshop

Related articles

View all blog articles
Learn more
1 min read

How to develop a taxonomy for your information architecture

When I first heard the word ‘taxonomy’, I had no idea what it meant. I remember enthusiastically nodding my head at my boss about how awesome it is while frantically Googling it under the table. We’ve all been there early on in our careers. Although, what I found left me feeling even more confused — something about classifying animals? Whether you’re as confused as I was all those years ago or just in need of a refresher, this quick guide to all things taxonomy will sort you out.

What is a taxonomy in information architecture?

In information architecture, taxonomy refers to how information is grouped, classified and labeled within a shared information environment. The overarching structure of that shared information environment is the information architecture (IA) and we find our way around it using the navigation. Think of an IA as a house. The taxonomy determines which pieces of furniture belong in each room and we navigate around the house via doorways and hallways. It all fits together to create one shared environment.

For a website architecture example, think of an online shoe store. The shoes might be organized and labelled by color, size, style, season or collection — that’s the taxonomy. The overall picture of where those groups of shoes live is the IA and in our pursuit of new shoes, we might navigate that structure via a navigation bar at the top of the page. In the amazing Grand Taxonomy of Rap Names visualization below, we can see how the information is categorized, connected and labeled through the lines and the colors. There’s no structure or hierarchy to it yet; that would be the next step in the process to build the IA.

A taxonomy visualization of rapper names
Source:http://hiphopmakers.com/grand-taxonomy-of-rap-names

Creating a taxonomy

There are so many different ways to carve information up into a taxonomy and the key drivers for determining that are your content and, of course, your users. Your taxonomy needs to make sense to your users.You may be starting from scratch with a new website or you may have inherited a taxonomy that for whatever reason just isn’t fit for purpose. The first step when creating an initial taxonomy is to do a comprehensive audit of your content. Ask yourself, is your content relevant? Is it up-to-date? Is it all necessary? Are there opportunities to delete or condense content? Once you have your content sorted, you’re ready to move on to the next step of running a card sort with users.Running a card sort early in your taxonomy creation process will allow you to build it up from an evidence based foundation. There’s no point guessing then testing and potentially going back to square one, when you can co-create with your users and then test that informed approach to validate and further evolve your thinking.When you’re designing your card sort, you’ll need to decide if you’re going to do an open, closed or hybrid sort. Here’s a very high level look at what each type involves:

  • Open: participants sort cards into groups and name their own categories
  • Closed: participants sort cards into categories determined by you
  • Hybrid: participants sort cards into categories determined by you AND they can also make up their own.

This early in the taxonomy creation process, it’s best to start out with an open card sort. Not only will this tell you how your users expect your content to be grouped, but will also provide insight into the language and labels that they would expect that content to be associated with. You never know, an open card sort may even surface something you hadn’t considered. At this stage of the process, it’s important to be open to ideas and new possibilities and an open card sort will do just that.Once you’ve settled on the type of card sort you’ll be running, you’ll need to test which can be done through a tool such as Optimal Workshop’s OptimalSort. OptimalSort enables you to run unmoderated card sorts remotely (or print out cards for a moderated/in-person card sort!). After your participants have completed your card sort, you can access the benefits of OptimalSort’s powerful result analysis functions.

Learn more about running a card sort and more through our 101 guide.

After you’ve run your initial open card sort with users, you should have everything you need to create the first iteration of your taxonomy. Consider everything you learned during the card sort and cross reference that with your business goals and any tech constraints you might be facing. Don’t stress too much about nailing it this time around — remember this is the first iteration and as you test more and learn more, you can make changes. Build out your taxonomy in Post-it notes with a team and then whack it into a spreadsheet to make future testing and iteration activities easier.

How to test a taxonomy

Now that you have the first iteration of your taxonomy, it’s time to have a go at structuring those groups into an IA and running a tree test. A tree test works like a card sort but in reverse — it allows you to test your thinking by working backwards. Optimal Workshop’s Treejack is an online tree testing tool that helps you assess the findability of your content without any visual design elements. All you need are clear objectives for what you’d like to learn more about and a spreadsheet version of your draft IA (told you it would come in handy! ).

Learn more about Treejack and tree testing through our equally handy 101 guide.

Another way to test your taxonomy thinking is to run another card sort. However this time, a hybrid or a closed card sort might be more suitable. A closed card sort would be useful if you’ve got evidence to suggest that your group labels are making sense to users but you’re not 100% sure what belongs in each group. A hybrid sort will let you go one step further and tell you if your content does in fact fit within those labels and if not you’ll also pick up some new ideas to iterate your taxonomy further.

Developing a taxonomy is like any other design process. Bring users into your process as early as you can and never stop iterating, improving and learning.Oh, and about those animals — I wasn’t entirely wrong. The way we classify animals (e.g., vertebrates and invertebrates) is a taxonomy. There are taxonomies everywhere and they’re not all digital. From libraries to supermarkets, we are immersed in taxonomies. It's the role of information architects to determine how these taxonomies are presented to us and how we navigate through them — the possibilities are truly endless!

Further reading

Learn more
1 min read

How to find (and solve) navigation issues on your website

Making your navigation work harder 💪🏼

There are many ways that your website can work wonderfully and of course, the converse is very true. There are lots of (simple) ways a website isn’t working as well or as hard as it can. Your website navigation is crucial to creating a brilliant user experience (UX). As well as being visible to search engine crawls, completing the circle by making your website more visible to potential visitors.

You’ve got a strong homepage, it’s modern, clean, bright and tells your story just right. But your conversions just don’t seem to be happening? Have you considered your navigation? No, not only the menu at the top of your website, but your Information Architecture (IA) sitting in behind. And not just this, but how it is used, interacted with and navigated by your users?

Even if you haven’t already identified an issue with your website it can be super valuable to test your usability regularly. Moments like; building a new website, adding, removing or structuring content can be times when navigation changes can impact how your website performs. And also can be a great instigator for testing and improving. There are some very effective tools to help with finding navigational issues, and with great data and insights shining the way to better sorting and ordering.

What is website navigation? ╰┈➤

Simply put, website navigation is the links within your website that connect the pages. The purpose is for your website visitors to find what they need on your site. And importantly it is also used by search engines to discover and index the content housed on your website.

Search engines use links between pages to understand context and relationships between pages. Ultimately building a picture of what your website is about and who would want to see it, and why. 

Whilst strong SEO is vital to finding users, it is always best to make sure your users come first. If your website only talks to search engines it is unlikely to really speak ‘human’ and do what it is intended, make conversions. Users first, search engines after.

Let’s explore some common navigational issues and how great UX research can solve them.

Your Information Architecture 🗺️

Your website Information Architecture (IA) is always important to consider. How content is stored, ordered and found will impact the UX and the performance of your website SEO. Using a card sorting tool to research how users expect information and content to be sorted, stored and found can be vitally important to how effective your website is. Optimalsort is a quick and effective tool to establish where and how users expect information to be sorted.

Building intuitive IA and making sure navigation, and menus are simple to follow will ensure your users are confident and comfortable making their way through your website. Understanding where they can find the information they need and progressing to the next step.

As well as understanding the order of content with card sorting, combined with our tree-testing tool, Treejack, it can be incredibly useful to understand where users expect information to be found. Looking at how users interact with your website, where they look for information and where they get lost is all great stuff!

Using these insights will keep them on your website longer, more likely to see the task through. And let’s not forget that search engines love it when your website is performing, keeping users longer with strong content that is seen as relevant.

Content hierarchy 📝

The order of your content is important. This can be how content is stored and the order of your navigation and creating intuitive IA. But can also be as simple as where navigational sign posts are. 

It seems obvious, but there is a case for keeping the most important information at the top of drop down menus, and where you want users to take action, usually on your most important pages. Studies show that attention and retention are highest for things that appear at the beginning and at the end of lists.

This is why ‘Contact’ should always be found at the top right corner, the last on the list and in a standard, expected location. Keeping this in mind when creating the order of your pages and what you want your users to interact with will inform your structure.

How is your website used now 👨🏻💻

Understanding exactly how your website is used currently and identifying areas that need to be improved will lead to much stronger user experience (UX). Usability testing should be an essential part of ongoing research for your website success.

One of the biggest issues with website usability is building intuitive navigation. If your users can’t find their way through your website to complete a task, they’re not going to try too hard. They’re far more likely to abandon and find another website (organisation) that makes it easy. Great navigation should act as a simple to follow map from landing page through to task completion. 

Using a research tool like Reframer can allow you to test how users complete tasks across your website. Following their journey from their first interaction through to task completion. The data will provide insights into how users engage, navigate and complete their tasks (or don’t). Where do they get stuck, lost or confused? How do they feel (even down to their body language)? How quickly can they find what they are looking for? And the next step?

All great stuff to inform the design team to build an engaging, usable website.

Homepage expectations 🤡

Your users already have set expectations when they arrive on your website. They anticipate your website to look and behave in a regular way that makes navigation, and their decisions, easy. Simple design features, such as your navigation menu across the top of the page, with clear options. It is vital to make life simple and easy when it comes to navigating your website. 

Creating an interface that looks clear, is easy and quick to follow will build trust and engagement quickly (remember the 2 second rule). Simple to follow navigation, including descriptive labels, can make completing tasks much simpler and quicker for your users. Guiding them smoothly through your website and ultimately to conversion.

Confusing homepage navigation  🫣

Your homepage is the hardest working page on your website. It’s the first place (most) users will interact with you and it is make or break. 

Did you know? You have less than 2 seconds to grab users with a well designed, organised and simple homepage. If they don’t immediately know what to do, trust what they see and get started they will move on (to someone else).

Increased bounce rate does the converse for your SEO. With a homepage that users bounce away from you are likely to see a drop in SEO rankings, meaning ultimately you will see less users!

Did you know that 87% of people that find themselves on the right path after the first click will complete their task? Ensuring that when users land on your homepage they can clearly find the road signs, but not everything that your website contains. Your homepage should simply guide your user to navigate your site, know what to do and how to do it. 

A cluttered, busy homepage with too many links will distract your users’ attention, confuse them and maybe even lose them forever! First-click testing will take an informative look at how your homepage interface is performing. Mapping where your user is clicking once they arrive on your homepage and conversely, where they are not engaging.

This can all be highly informative in designing, re-designing or even removing clicks from the users journey through your homepage, and beyond. Using Chalkmark to test your users first clicks is a great way to get started now.

Wrap up 🥙

With a website that is intuitive to navigate and content that is relevant you will find users that are engaged and SEO that ranks!

Get started quickly and simply with our range of tools to sort out your navigation.

And, if you need some more inspiration to help improve your website navigation, grab yourself a copy of our Actionable IA guide that explores actionable ways to fix, refine and build better IAs.

Learn more
1 min read

Navigating the Complexities of Information Architecture vs Data Architecture

Thanks to an ever-growing digital world, businesses are spoiled for information and data. The more complex the business, the more information there is and the more complicated the business requirements are. But where there are challenges, there is opportunity. That’s where information architecture and data architecture come in.

Information and data architecture both seek to make sense of the plethora of information a business handles. However, the two have different roles to play in the way businesses use, move, maintain, and present data - both to internal and external stakeholders. So what are they and why should businesses take note?

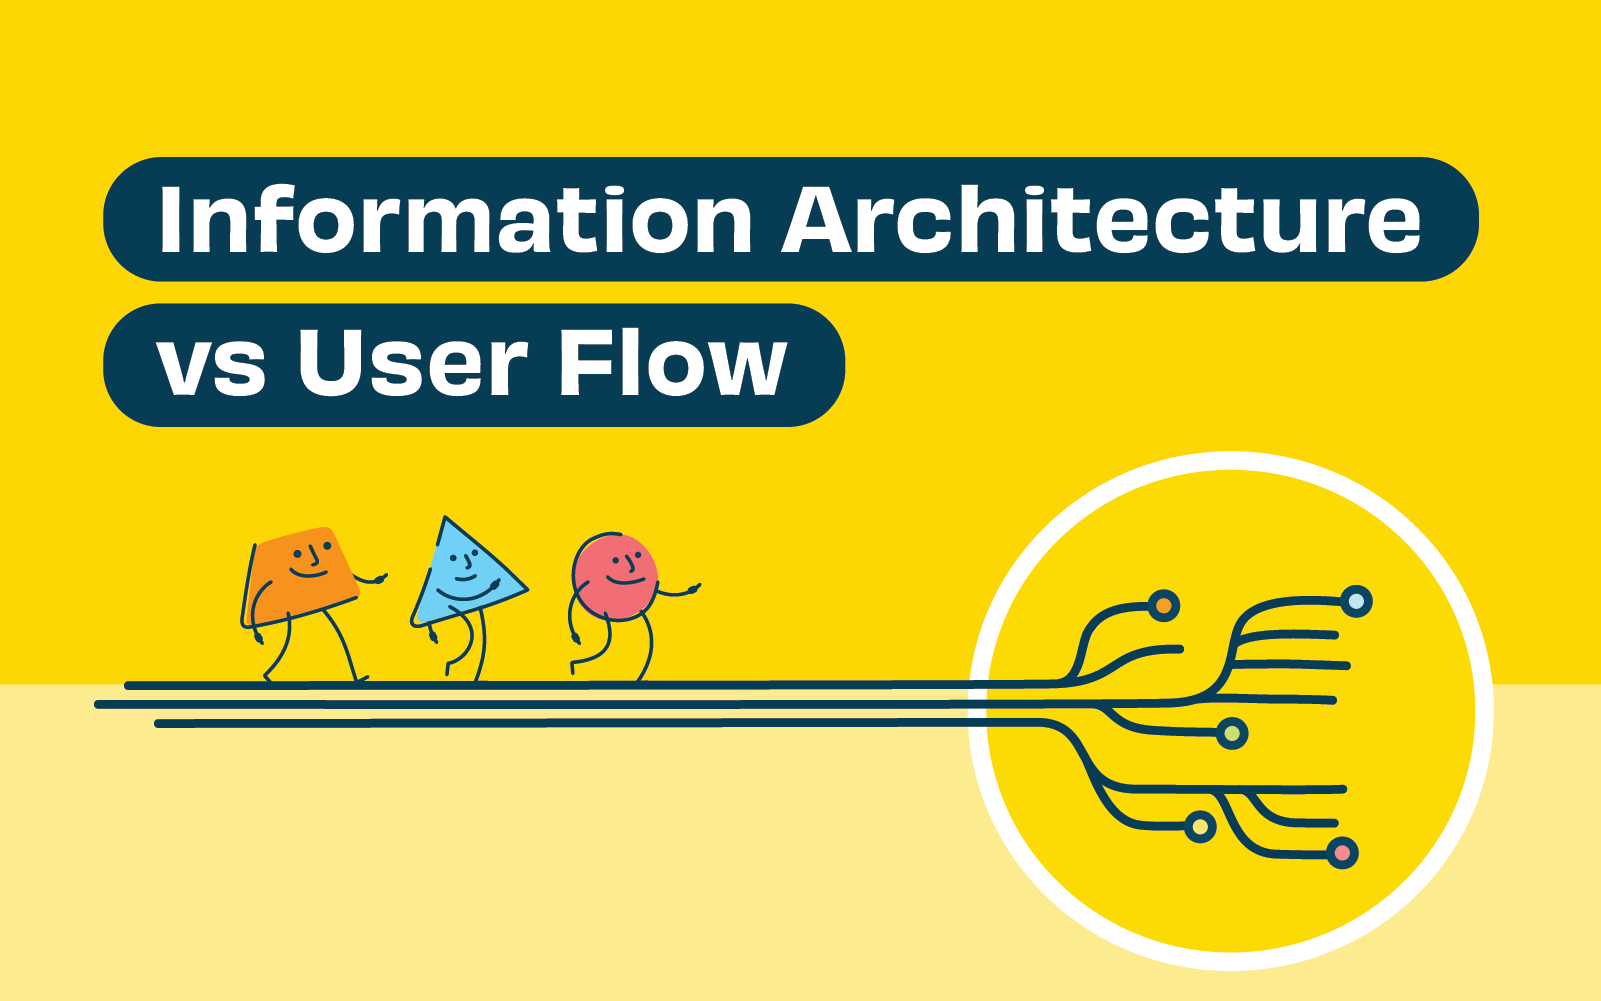
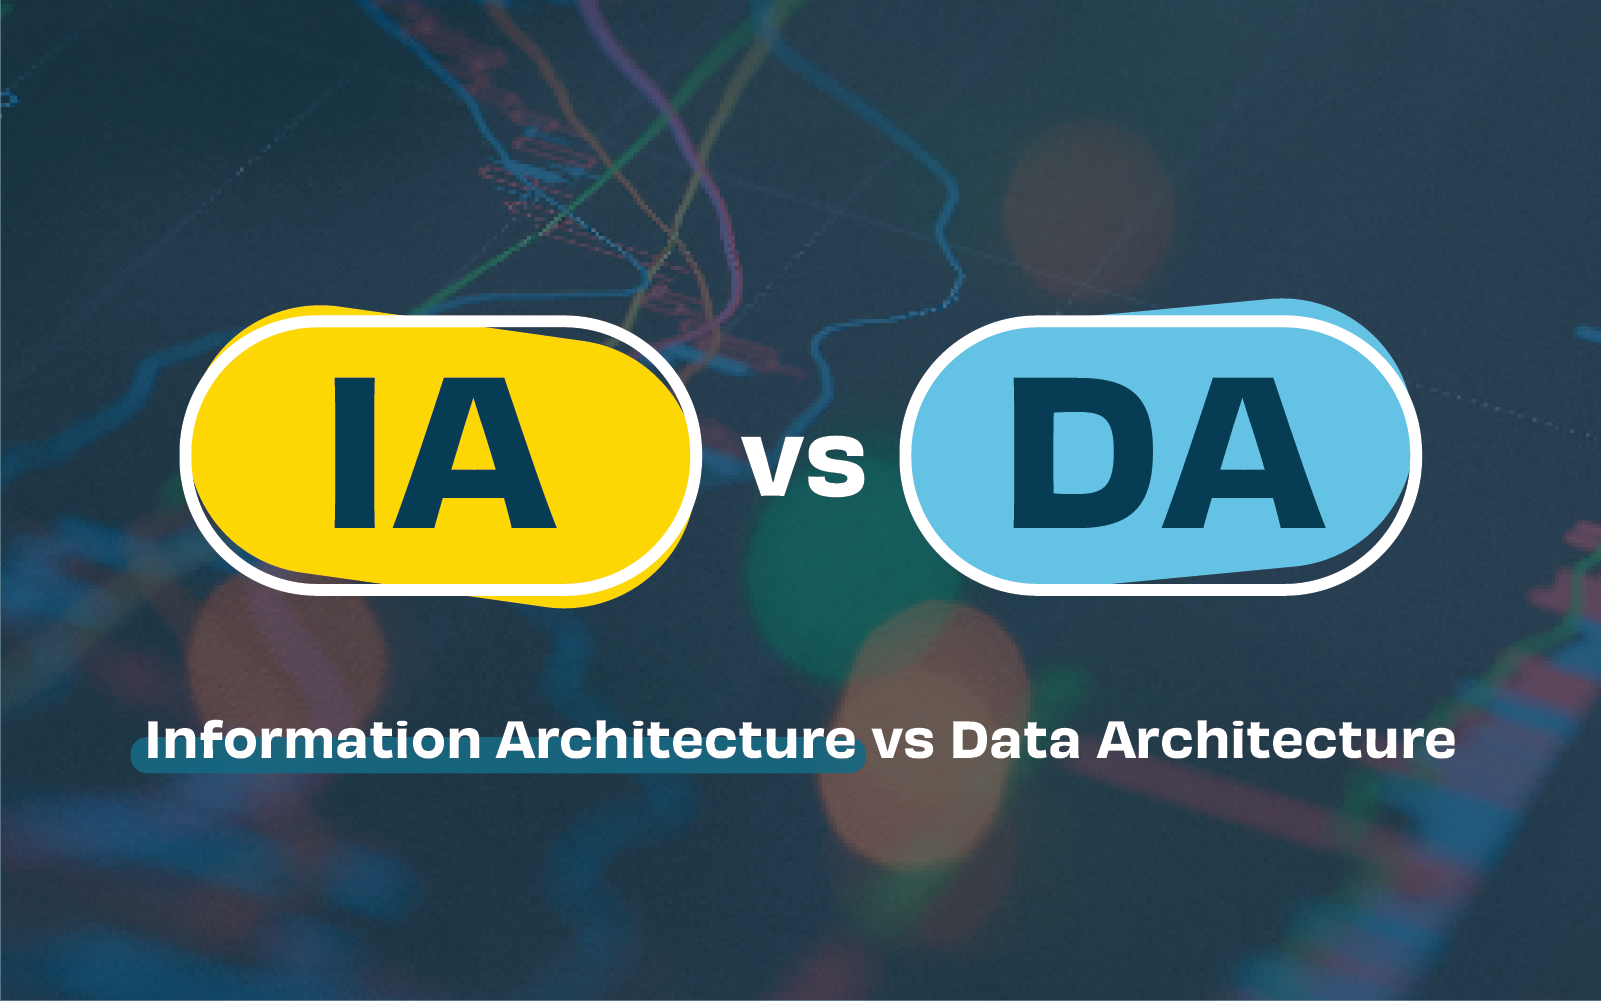
Defining Information Architecture 🗺️

Information architecture is the structure used to organize and label content on websites, mobile applications and other digital environments. Its primary purpose is to enhance user experience by ensuring information is structured in an accessible, usable and relevant way.

Information architecture seeks to understand user needs and goals by analyzing both existing and required information, then building an information framework in a logical and user-friendly way. It deals with three main components:

  • Labels: How information is represented
  • Navigation: How users make their way through the information
  • Search: How users look for information

Whilst this information sits in the background, it’s the layer upon which you build the design of your digital products.

Information architects bring data from file systems and databases to life by building meaningful narratives and stories. Outputs can include site-mapping, information architecture diagrams and content inventories. These outputs are supported by user research techniques such as card sorting, tree testing, user surveys and first-click testing.

Defining Data Architecture 💻

Data architecture bridges the gap between business needs, goals, and system requirements related to data handling. It sets out a framework for managing data assets, the flow of data and the maintenance of data systems. As such, it has a slightly more macro view than information architecture and concerns itself with emerging technologies such as artificial intelligence, machine learning, and blockchain.

Where information architecture centers around the end-user interaction, data architecture centers around practical handling and operation of data processes i.e. collection through to transformation, distribution, and consumption. Because of this, data architecture must take into account the businesses ability to scale operations, integrate with third party systems, support real-time data processes and the reduction of operating costs. Modern data architecture may point to artificial intelligence to tackle some of these challenges.

The Importance of Enterprise Architects in Information and Data Architecture 🏗

Enterprise architects are big-picture people. Data architecture and information architecture both fall within their remit, and they often oversee other data management job specialities within an IT department.

As a leader (and often, visionary) within a business, enterprise architects shoulder the responsibility of ‘mission critical’ projects. As a result, they tend to have several years experience with IT systems, backed by a bachelor’s degree in computer science, IT management, data science or similar. Many will hold a master’s degree and specialty certifications.

The role involves collaborating with senior business leaders, solution-delivery teams and external stakeholders, and requires creative problem solving and excellent communication skills. Therefore, enterprise architects very much steer the ship when it comes to information and data architecture. Combining high-level business strategy with knowledge of ‘the nuts and bolts’ of IT data systems and processes, they command an annual salary in New Zealand between $150,000 and $200,000 per annum..

Continuous improvement within any business that has substantial IT infrastructure calls for serious investment in enterprise architecture.

Designing and Implementing an Effective Information and Data Architecture 𝞹📈🧠📚

Once overarching business goals are aligned with the scope of data and system requirements, information and data architecture design (or redesign) can begin.

Crucial to the design and implementation process is developing an architecture framework. This is a set of guidelines that lays out principles, practices, tools and approaches required to complete the design. It supports system design decisions, assigns key tasks and provides project guidance throughout the design process. The framework essentially aims to unite disparate teams and maintain business and IT alignment.

The choice of architecture design is also critical. It should consider scalability, performance, maintainability and adaptability to emerging technology. Which is why cloud platforms feature so heavily in modern data architecture. Cloud architects will navigate the architecture design and technical requirements of cloud-based delivery models, which offer the solution to those scalability and adaptability challenges. They are responsible for bridging the gaps between complex business problems and solutions in the cloud. Modern data architecture tends to involve some form of cloud delivery component.

Throughout implementation, data and information architects will work closely with designers and engineers until testable architecture is ready. User research and testing will be carried out, and a feedback loop will commence until requirements are met. Users, as always, should be at the center of your digital product.

Summing Up the Complexities of Information and Data Architecture 🧮

Whilst the difference between information and data architecture can appear nuanced on the surface, they hold unique roles when delivering a cohesive, user-friendly digital product.

Think of a sliding scale where business operations sit at one end, and users sit at the other. Data architecture addresses challenges closer to the business: aligning business requirements and goals with how data flows through the system. On the other hand, information architecture addresses the challenges related to how this data is organized and interpreted for the end user.

At the end of the day, both information and data architecture need to work in harmony to satisfy the user and the business.

Seeing is believing

Explore our tools and see how Optimal makes gathering insights simple, powerful, and impactful.