“Questions are never indiscreet, answers sometimes are.”Oscar Wilde
Frequently asked question pages. Love them or hate them, I don’t think they’re going anywhere anytime soon. This debate has been going on for quite some time and there is an equal number of opinions on both sides of the FAQ fence. Nielsen Norman Group’s Susan Farrell says FAQs can still add value to a website when done properly, and Gerry McGovern says FAQs are the dinosaurs of web navigation.
So, how do we really know for sure if they will or won’t add value to a design? Like anything in UX, you have to test it! I don’t know about you, but I’m a shake-it-and-see-what-falls-out kind of UXer, so naturally I decided to run a Treejack study. Scouring the web one fine day, I came across Sainsbury’s Active Kids. Its FAQ page was unlike any I had ever seen and I knew I’d found the one. I was also curious to see how it would test with people who don’t use the website — after all, anyone should be able to use it. Since Active Kids is an active lifestyle program for UK schools and sports clubs, I recruited my participants entirely from the US.
Pull up a chair and get comfy because what I found out should serve as a lesson to us all.
Why Active Kids? 🤸🏼
First of all, why did I choose this in the first place? The Active Kids FAQ page caught my attention for three main reasons:
structure
labels
content
The structure of this FAQs page is quite deep, complex and very different from the rest of the site — almost like another information architecture (IA) had been built within the main structure. Imagine you have a large warehouse with hundreds of shelves, and then somewhere in the middle of it, someone builds a house — that’s how it felt to me.
There are two ways to get to it: through the “Help” label on the top navigation bar and the “FAQ” label in the footer. It also uses a combination of drop-down filters that the user needs to apply, but it also has automatic filter options and confusing labels that can send you down a path you don’t necessarily want to take.
I also found it very interesting that most of the information contained within the FAQs section cannot be located anywhere else on the website and most of this is essential to gaining a fundamental understanding of what Active Kids actually does. Adding to the house in the warehouse analogy, it’s like the house holds all the key information the warehouse needs to function, but no one knows which room it’s kept in.
Setting up the study 🛠️
Treejack was the perfect choice for testing the findability of information on the Active Kids FAQ page and I decided to test the IA of the website as a whole — this means both the warehouse and the house. I couldn’t just test the house in isolation because that’s not how a user would interact with it. The test needed the context of the whole site to gain an understanding of what’s going on. Creating a Treejack study is quick and easy and all you have to do is build the structure out in a basic Excel spreadsheet and then copy and paste it into Treejack.
My next job was to determine the task based scenarios that my participants would use during the study. I decided to choose nine and all were derived from content located in the FAQs section and related to tasks a user might carry out when investigating or participating in the program. Once I had my tree and my tasks, all I had to do was set the correct answers based on where the information currently sits on the Active Kids website and I was ready to launch.
Recruiting participants for the study🙋🏾
In my experience,recruiting participants for a Treejack study is quick and easy. All you have to do is determine the screener criteria for your participants and Optimal Workshop takes care of the rest. For this study I requested 30 participants and they all had to reside in the US. I ended up with 31 completed responses and it was all over in less than two hours.
Treejack results 🌲
So, what fell out of that tree when I tested a website aimed at parents and teachers of kids in the UK with 31 Americans? I’ll be honest with you: it wasn’t pretty. Here’s what I discovered in this study:
The overview tab for the Treejack results
81 per cent were unable to find out if home educators were eligible to apply (number 1 on the graph)
65 per cent were unable to find out what a Clubmark accreditation is (number 2 on the graph)
68 per cent were unable to find out how to share their wishlist with friends and family (number 3 on the graph)
64 per cent could not find the information that would explain the purpose of the £1 fee mentioned in the terms and conditions (number 4 on the graph)
97 per cent could not locate the information that would tell them if they could use a voucher from 2014 in 2015 (number 5 on the graph)
No participant was able to determine if students from a middle school would be able to participate in Active Kids (number 8 on the graph)
58 per cent of participants in this study were unable to find out what the program is even about (number 9 on the graph)
On the flip side, 68 per cent of participants in this study were able to locate a phone number to contact Active Kids directly (number 6 on the graph) and 97 per cent were successfully able to work out how to redeem vouchers (number 7). Overall, it wasn’t great.In addition to some very useful quantitative data, Treejack also provides detailed information on the pathways followed by each participant.
Understanding the journey they took is just as valuable as discovering how many found their way to the correct destination. This additional level of granularity will show you where and when your user is getting lost in your structure and where they went next. It’s also handy for spotting patterns (e.g., multiple participants navigating to the same incorrect response).
I always set my studies to collect responses anonymously and when this occurs, Treejack assigns each participant a numerical identifier to help keep track of their experience without the participant having to share his or her personal details. For task 6, the paths chart below shows that participants numbered eight to 20 were able to navigate directly to the correct answer without deviating from the correct path I defined during setup.
Paths followed by participants in this study for Task 6
For Task 3 (below) , the story told by the paths was quite different. Participant number five navigated back and forth several times through the structure in their attempt to locate information on how to share a wishlist. After all that effort, they were unable to find the information they needed to complete the task and nominated to contact Active Kids directly. Not only is this a bad experience for the user but it also puts unnecessary pressure on the call centre because the information should be readily available on the website.
Paths followed by participants in this study for Task 3
Treejack also provides insights into where participants started their journey by recording first click data. Just like Chalkmark, this functionality will tell you if your users are starting out on the right foot from that all important first click.In this study I found it interesting that when looking for information regarding the eligibility of home educators in the Active Kids program, 42 per cent of participants clicked on “Schools & Groups” and 19 per cent clicked on “Parents & Community” for their first click. Only 6 per cent clicked on “Help”, which happens to be the only place this information can be found.
First click results for Task 1
I also found the first click results for Task 9 to be very interesting. When looking for basic information on the program, more than half (52 per cent) of the participants in this study went straight to “Help”. This indicates that, for these participants, none of the other options were going to provide them the information they needed.
First click results for Task 9
What can be learned from this study? 🎓
I mentioned earlier there was a lesson in this for everyone, and rather than dwell on how something tested, it’s time to move on to some lessons learned and constructive ideas for improvement. Based on the results of this Treejack study, here are my top three recommendations for improving the Active Kids website:
Rethink the content housed in the FAQs section
Most of the key information required to master the basics of what Active Kids is all about is housed entirely in the FAQs section. FAQs should not be the only place a user can find out basic information needed to understand the purpose of a product, program or service. I believe this website would benefit from some further thinking around what actually belongs in the FAQs section and what could be surfaced much higher.
Another idea would be to follow the lead of the Government Digital Service and remove the FAQs section altogether — food for thought. Frequently asked questions would not be frequently asked questions if people could actually find the information on your site in the first place. Figure out where the answers to these questions really belong.
If you’re using Treejack, just look at the fails in your results and figure out where people went first. Is there a trend? Is this the right place? Maybe think about putting the answer the user is looking for there instead.
Restructure the FAQs section
If you must have an FAQs section (and believe me I do understand that they don’t just disappear overnight! Just try to keep it as an interim solution only) please consider streamlining the way they are presented to the user. Ditch the filtering and display the list on one page only. Users should not have to drill down through several layers of content and then navigate through each category. For further reading on getting your FAQs straight, this Kissmetrics article is well worth a read.
Review the intent of the website
Looking at the Active Kids website and the results from this study, I feel the intent of this website could use some refining. If we come back to my warehouse and house analogy, the main chunk of the website (the warehouse) seems to be one giant advertisement, while the house (the FAQs) is where the action-oriented stuff lies. The house seems to hold the key information that people need to use the program and I think it could be displayed better. Don’t get me wrong, Active Kids does some incredibly good work for the community and should absolutely shout its achievements from the rooftops, however a sense of balance is required here. I think it’s time for the house and the warehouse to join forces into a solution that offers both rooftop shouting and usable information that facilitates participation.
The value of fresh eyes 👀
This study goes to show that regardless of where you are in your design process, whether that’s at the very beginning or a few years post-implementation, there is value to be gained from testing with a fresh set of eyes. I’m still undecided on which side of the FAQs debate I belong to — I’m going to sit on the fence and stand by the “if in doubt — test it” school of thought.
Sitting inside any beautifully crafted and designed digital product, there must be a fully functional and considered information architecture.
As much as information architecture shouldn’t be developed in a vacuum. Neither should the design and look of digital products. In fact, a large proportion of the function of digital designers is devoted to supporting users locating content they need and driving them towards content that the product owners want them to find.
Incorporating visual markers to make sure that certain content is distinct from the rest or creating layers that demonstrate the diverse content on a product.
If you do not have quality content, it is impossible to design a quality digital product. It all comes back to creating a user experience that makes sense and is designed to make task completion simple. And this relates back to designing the product with the content planned for it in mind.
8 Principles of information architecture, according to Dan Brown 🏗️
As a designer, the more you know about information architecture, the better the products you design will meet your user requirements and deliver what they need. If you work with an information architect, even better. If you’re still learning about information architecture the 8 Principles according to Dan Brown is a great place to begin.
If you haven’t come across Dan Brown yet, you have more than likely come across his 8 principles. Dan Brown is one of the UX world's most prolific experts with a career that spans most areas of UX designs. He’s written 3 books on the subject and experience across a multitude of high profile projects. Aiding large organizations to make the most of their user experience.
The principle of objects: Content should be treated as a living, breathing thing. It has lifecycles, behaviors, and attributes.
The principle of choices: Less is more. Keep the number of choices to a minimum.
The principle of disclosure: Show a preview of information that will help users understand what kind of information is hidden if they dig deeper.
The principle of examples: Show examples of content when describing the content of the categories.
The principle of front doors: Assume that at least 50% of users will use a different entry point than the home page.
The principle of multiple classifications: Offer users several different classification schemes to browse the site’s content.
The principle of focused navigation: Keep navigation simple and never mix different things.
The principle of growth: Assume that the content on the website will grow. Make sure the website is scalable.
It’s highly likely that you’ve already used some, or all, of these IA principles in your designs. Don’t be shy about mastering them, or at the very least be familiar. They can only help you become a better user experience designer.
Wrap up 🌯
Mastering the 8 principles, according to IA expert Dan Brown will see you mastering the complex tasks of information architecture. Understanding IA is key to creating digital designs with a content structure that is functional, logical and just what your users need to navigate your product. Design without good IA doesn’t work as well, just as a content structure without a well designed interface will not engage users.
Click, click, click, BOOM! There it is. That thing you were looking for. You couldn’t find it on other websites, but you found it here, and it was easy. You feel like a hero. You thank the website and you leave with a sense of achievement.
What if you could replicate that feeling on your website? What if you could make every user journey so satisfying? By combining information architecture and user flow, you can.
But what are they and how are they different? In this article, we’ll explain how they influence website design and how you can (and should) use them together in your project. We’ll also discuss different user flow research techniques, how they inform great information architecture, and how it doesn’t have to be difficult or time consuming.
What is Information Architecture? 🏗️
Information architecture is the system and structure you use to organize and label content on your website, app or product. It relates closely to user experience design, but it’s slightly different. Think of it as the structure or framework upon which user-facing assets are built.
That being the case, if your information architecture has flaws, your website design will have flaws. It determines how information will be accessible, usable and relevant on your website and should be treated as a critical element of your project. How can we ensure that we have our content organized efficiently to promote seamless interactions?
The answer is research. Without research you’re just guessing. The problem with guessing is that, well, you’re guessing. You tend to organize, categorize and label things the way that you (and maybe your team) would organize things. It’s biassed and subjective. In reality, people process information in all sorts of different ways and good information architecture should reflect that. You’ll often hear us say ‘test early and test often’. This mantra helps to avoid any little niggles during the user experience design process. Card sorting and tree testing are a couple of techniques that you can use to test early.
Card sorting is a research technique that asks users to categorize different pieces of information or content. It’s best used when you have specific, information-related questions. For example, you may want to categorize products in an online store in the most logical way. Or you may have a mountain of blog post categories that need refining. Whatever it is, the benefit of a card sort is that you end up with consensus of how your users expect to see information. Card sorts can even be performed remotely using tools such as OptimalSort.
Tree testing examines how easy it is for your users to find information using a stripped back, text-only representation of your website - almost like a sitemap. Rather than asking users to sort information, they are asked to perform a navigation task, for example, “where would you find today’s best deals?”. Depending on how easy or difficult users find these tasks gives you a great indication of the strengths and weaknesses of your underlying site structure.
As the base structure of your website or app, information architecture has a fundamental influence on how well users access and use your content. It makes sense then that when designing it, you should receive real-world user feedback early on in the piece. Fortunately, there are great online tools like Treejack to quickly and easily test your site structures, categorization and labels.
What is User Flow? 🌊
User flow describes the steps involved for a user to complete a certain task. It lays out what needs to happen for a user to get from starting point to a defined finish line. Why is it important? Because we want that journey to be as efficient as it can possibly be. If it’s not, the user will be left frustrated and dissatisfied, no matter how beautiful the website design is.
At the heart of user flow is, you guessed it, the user. A path that seems obvious to designers might be confusing to an end-user. It’s important to distance yourself from the project and put yourself in the user's shoes. Even better - watch the user. How do they react to a fork in the road? How do they get back on track? Where are they stumbling?
User testing is a great way to observe user flow. But what are you testing? Normally you test based on a user flow diagram. A user flow diagram is generated based on insights from your research from card sorting, tree testing, and questionnaires, for example. It visually outlines the possible paths a user can take to achieve a certain task. The basic structure of a user flow diagram considers the following:
A critical path
Entry points
User end goals
Success metrics (time to completion, number of clicks)
Steps the user will take in between
Once you have created a user flow diagram you can test it with your users. User testing can be remote or in person and uses a variety of techniques depending on the constraints of your projects. You may consider testing something rough and conceptual like a paper prototype before producing more detailed prototypes.
How to Use Information Architecture and User Flow Together 🤝🏻
By doing the work upfront to create great information architecture you put yourself in a great position to create great user flow. After all, information architecture is designed based on user research. Performing content audits and creating content inventories help to inform early content decisions, followed by user research techniques such as card sorting and tree testing. This research has a direct influence on user flow, since information and content has been given meaning and structure.
The foundational work in designing information architecture leads to user flow diagrams which, as we discussed, are helpful tools in creating seamless user flow. They bridge the gap between information architecture and final user experience by visualizing pathways of specific tasks. By performing user tests on prototypes, the researcher will inevitably find speed bumps, which may highlight flaws in information architecture.
Information architecture and user flow are integrated. This means there should be a constant feedback loop. Early research and categorisation when building information architecture may not translate to seamless user flow in practice. This could be due to integration factors outside of the digital ecosystem you’re designing.
User flow and information architecture are complementary components of creating exceptional website design. Designers should make a conscious decision to apply both in synchrony.
To Sum it Up 🧾
Understanding the relationship between information architecture and user flow is important for any website design. Information architecture provides the organization and structure of content, where user flow applies that structure to how users execute certain tasks in the simplest possible way. The two are intertwined and, when used effectively, provide a framework to ensure seamless, user-friendly website design.
User research and user testing heavily influence the design of both information architecture and user flow. We want users to feel a sense of accomplishment rather than frustration when using a website. Achieving this requires an investment in understanding user needs and goals, and how they consume and categorize information. This is where research techniques such as content audits, tree testing, card sorting and user testing become invaluable.
We’ve always placed high value on solid research, but don’t be put off by it. The research techniques we’ve discussed are highly scalable, and you can be as involved as you want or need to be. Sometimes you don’t even have to be in the same room! The most important thing is to get outside of your team’s bubble and gain real user insight. Check out our information architecture services to ensure you’re on the right path towards powerful, user-centric website design.
According to Abby Covert, author, teacher and community leader in the field of information architecture (IA) : ‘IA is the way we arrange pieces of content to make sense when experienced as a whole. By this definition: there is information architecture in everything. Mindblown?’
😮 (That’s a resounding yes from an IA rookie like me.)
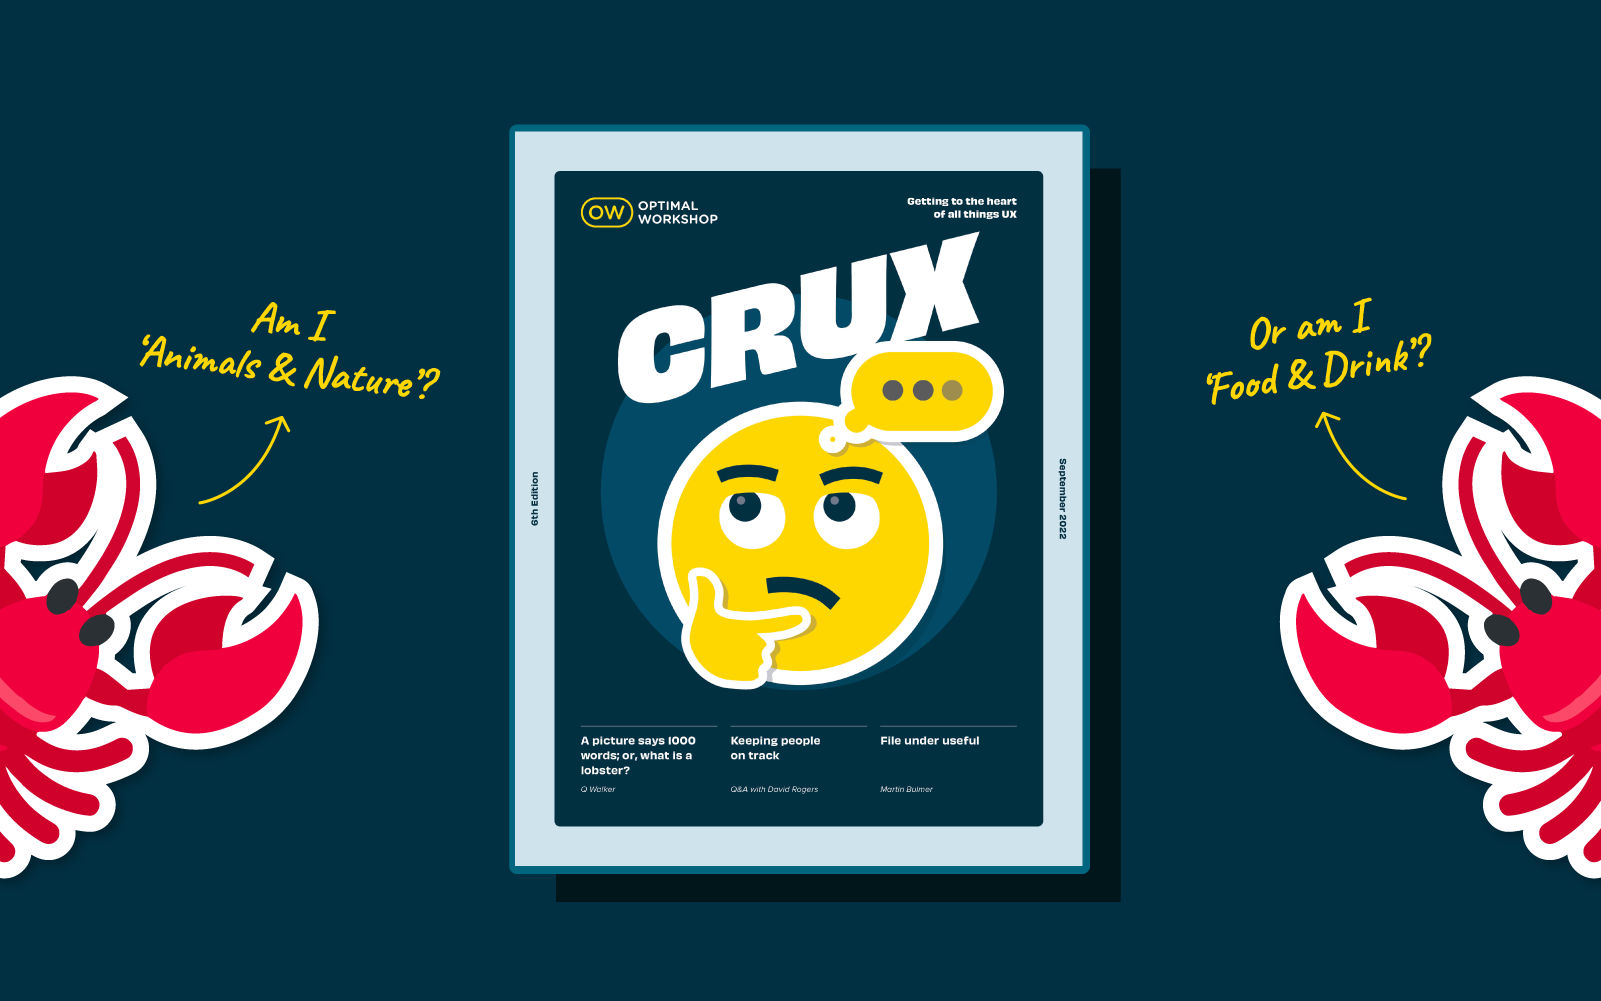
In this issue of CRUX we go in search of information architecture and have some surprising encounters in the worlds of emoji, elevators, walking tracks, games and more. We meet UX designers, developers, researchers and even a Senior Park Ranger. It seems you can have your ‘IA hat’ on without even realising it. That’s the power of information architecture.
Some highlights from this issue:
UX research and strategy specialist, Q Walker explores the world of emoji from an information architecture perspective and sparks curiosity along the way. Have you ever wondered why clock emojis are organized under travel and places? 🤔
We talk to Senior Park Ranger David Rogers about the thinking behind creating and building New Zealand’s national walking track network and reveal how information architecture can also live ‘in the wild’.
UX developer Ben Chapman delves into the classification systems of libraries over time and ponders the pros and cons for users of moving information online.
We talk to Sam Cope, Lead UX Designer at Wētā Workshop’s Interactive division about what it takes to drive design decisions with the end user in mind - something crucial for any video game’s success, whether it’s a blockbuster or something more niche.
And much more about information architecture in unexpected places….
The stories and people in this issue of CRUX certainly captured our imagination and attention - we hope they inspire and even surprise you too.
Do you have a burning idea to share or a conversation you’re dying to kickstart that’s of interest to the world of UX? Now’s your chance. We’re already on the lookout for contributors for our next edition of CRUX for 2022. To find out more please drop us a line.