

Knowing and understanding why and how your users use your product is invaluable for getting to the nitty gritty of usability. Delving deep with probing questions into motivation or skimming over looking for issues can equally be informative.
Put super simply, usability testing literally is testing how usable your product is for your users. If your product isn’t usable users often won’t complete their task, let alone come back for more. No one wants to lose users before they even get started. Usability testing gets under their skin and really into the how, why and what they want (and equally what they don’t).
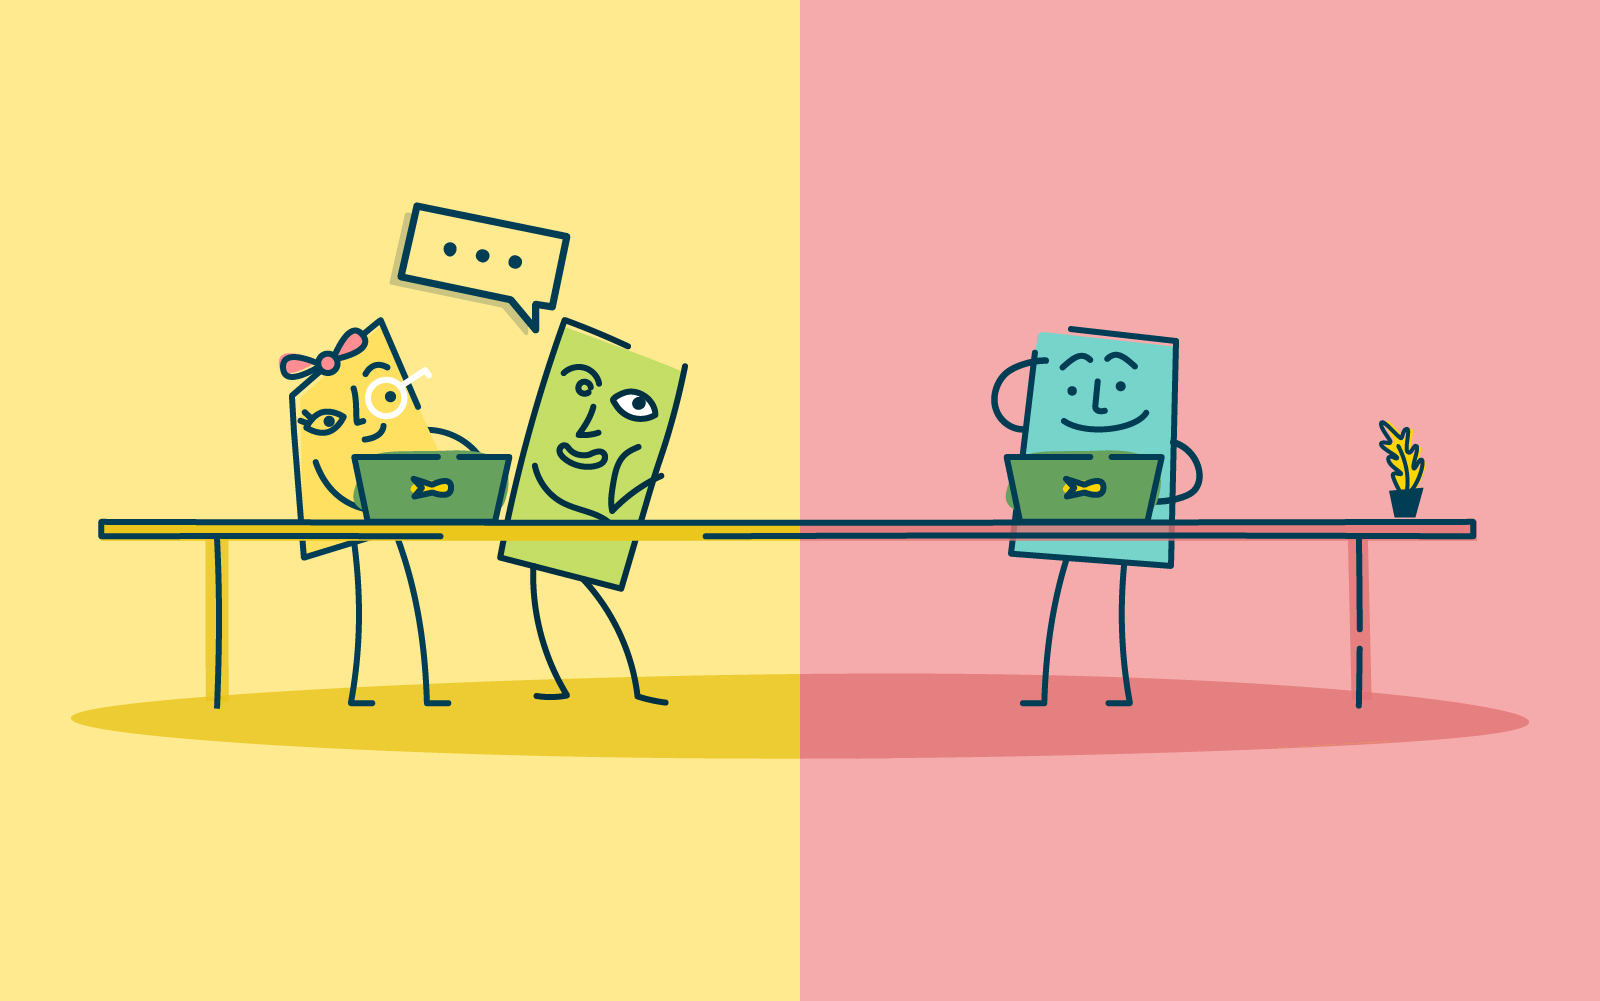
As we have been getting used to video calling regularly and using the internet for interactions, usability testing has followed suit. Being able to access participants remotely has allowed us to diversify the participant pool by not being restricted to those that are close enough to be in-person. This has also allowed an increase in the number of participants per test, as it becomes more cost-effective to perform remote usability testing.
But if we’re remote, does this mean it can’t be moderated? No - remote testing, along with modern technology, can mean that remote testing can be facilitated and moderated. But what is the best method - moderated or unmoderated?
What is moderated remote research testing?
In traditional usability testing, moderated research is done in person. With the moderator and the participant in the same physical space. This, of course, allows for conversation and observational behavioral monitoring. Meaning the moderator can note not only what the participant answers but how and even make note of the body language, surroundings, and other influencing factors.
This has also meant that traditionally, the participant pool has been limited to those that can be available (and close enough) to make it into a facility for testing. And being in person has meant it takes time (and money) to perform these tests.
As technology has moved along and the speed of internet connections and video calling has increased, this has opened up a world of opportunities for usability testing. Allowing usability testing to be done remotely. Moderators can now set up testing remotely and ‘dial in’ to observe participants anywhere they are. And potentially even running focus groups or other testing in a group format across the internet.
Pros of moderated remote research testing:
- In-depth gathering of insights through a back-and-forth conversation and observing of the participants.
- Follow-up questions don’t underestimate the value of being available to ask questions throughout the testing. And following up in the moment.
- Observational monitoring noticing and noting the environment and how the participants are behaving, can give more insight into how or why they choose to make a decision.
- Quick remote testing can be quicker to start, find participants, and complete than in-person. This is because you only need to set up a time to connect via the internet, rather than coordinating travel times, etc.
- Location (local and/or international) Testing online removes reliance on participants being physically present for the testing. This broadens your ability to broaden the pool, and participants can be either within your country or global.
Cons of moderated remote research testing:
- Time-consuming having to be present at each test takes time. As does analyzing the data and insights generated. But remember, this is quality data.
- Limited interactions with any remote testing there is only so much you can observe or understand across the window of a computer screen. It can be difficult to have a grasp on all the factors that might be influencing your participants.
What is unmoderated remote research testing?
In its most simple sense, unmoderated user testing removes the ‘moderated’ part of the equation. Instead of having a facilitator guide participants through the test, participants are left to complete the testing by themselves and in their own time. For the most part, everything else stays the same.
Removing the moderator, means that there isn’t anyone to respond to queries or issues in the moment. This can either delay, influence, or even potentially force participants to not complete or maybe not be as engaged as you may like. Unmoderated research testing suits a very simple and direct type of test. With clear instructions and no room for inference.
Pros of unmoderated remote research testing:
- Speed and turnaround, as there is no need to schedule meetings with each and every participant. Unmoderated usability testing is usually much faster to initiate and complete.
- Size of study (participant numbers) unmoderated usability testing allows you to collect feedback from dozens or even hundreds of users at the same time.
- Location (local and/or international) Testing online removes reliance on participants being physically present for the testing, which broadens your participant pool. And unmoderated testing means that it literally can be anywhere while participants complete the test in their own time.
Cons of unmoderated remote research testing:
- Follow-up questions as your participants are working on their own and in their own time, you can’t facilitate and ask questions in the moment. You may be able to ask limited follow-up questions.
- Products need to be simple to use unmoderated testing does not allow for prototypes or any product or site that needs guidance.
- Low participant support without the moderator any issues with the test or the product can’t be picked up immediately and could influence the output of the test.
When should you do moderated vs unmoderated remote usability testing?
Each moderated and unmoderated remote usability testing have its use and place in user research. It really depends on the question you are asking and what you are wanting to know.
Moderated testing allows you to gather in-depth insights, follow up with questions, and engage the participants in the moment. The facilitator has the ability to guide participants to what they want to know, to dig deeper, or even ask why at certain points. This method doesn’t need as much careful setup as the participants aren’t on their own. While this is all done online, it does still allow connection and conversation. This method allows for more investigative research. Looking at why users might prefer one prototype to another. Or possibly tree testing a new website navigation to understand where they might get lost and querying why the participant made certain choices.
Unmoderated testing, on the other hand, is literally leaving the participants to it. This method needs very careful planning and explaining upfront. The test needs to be able to be set and run without a moderator. This lends itself more to wanting to know a direct answer to a query. Such as a card sort on a website to understand how your users might sort information. Or a first click to see how/where users will click on a new website.
Planning your next user test? Here’s how to choose the right method
With the ability to expand our pool of participants across the globe with all of the advances (and acceptance of) technology and video calling etc, the ability to expand our understanding of users’ experiences is growing. Remote usability testing is a great option when you want to gather information from users in the real world. Depending on your query, moderated or unmoderated usability testing will suit your study. As with all user testing, being prepared and planning ahead will allow you to make the most of your test.
