

In the fast-paced world of tech startups and scale-ups, having a strong set of core values is crucial for sustainable growth and success. As the CEO of Optimal Workshop, a best-in-class research and insights platform, I've learned firsthand the importance of establishing and nurturing the right company culture. Today, I'd like to share our journey of revisiting and refining our values, and how these principles are shaping our path forward.
The power of values in leadership 🫶
This is my third run as a CEO, following leadership roles at the digital consultancy Tigerspike and the EdTech company Education Perfect. Each time, I've faced the challenge of taking the business to a whole new level. From experience, I've learned that this transformation begins with getting all the right pieces in play for future growth.
At Optimal Workshop, we've been busy laying the groundwork for our next phase of expansion:
1. Forming a new leadership team
2. Launching a fresh brand identity
3. Developing a new strategy and product direction
4. Introducing our refined team values
These elements, particularly our values, are not just words on a wall. They underpin our future way of working and set the standard for the behaviors we expect from every team member. By doing so, we're creating a culture of high performance with solid foundations to build upon and scale globally.
Our core values: The heart of Optimal Workshop 💖
In April 2024, we embarked on a journey to revisit and refine our company values. This process was collaborative and thoughtful, involving input from team members across all levels of the organization. The result is a set of four core values that truly represent who we are and who we aspire to be:
1. Live in our customers' shoes
At Optimal Workshop, we believe that our success is intrinsically tied to the success of our customers. This value emphasizes empathy, understanding, and a customer-centric approach to everything we do. Team members who embody this value:
- Deeply understand our products and champion user research and data-driven methodologies
- Go above and beyond to support our customers, ensuring they derive maximum value from our products and services
- Show a profound understanding of customer pain points and challenges, always seeking ways to enhance the customer experience
- Prioritize customer satisfaction and strive to provide the highest level of service in all their endeavors
2. Own it
We take pride in our expertise and resilience. This value is about taking initiative, holding ourselves to high standards, and fostering an environment of trust and commitment. An "Own It" mindset means:
- Demonstrating reliability and accountability, stepping up to challenges and delivering on promises
- Being solution-focused, supporting others, and finding the best outcomes for all stakeholders
- Bringing a high level of quality to daily work, advancing projects while maintaining excellent standards
- Communicating openly and transparently, and professionally challenging the status quo when necessary
3. Game On!
In the dynamic world of tech and user research, adaptability and continuous learning are key. Our "Game On!" value encapsulates our readiness to pivot, our curiosity, and our commitment to constant improvement. Team members who exemplify this value:
- Demonstrate the ability to change direction quickly and adapt to new circumstances
- Actively contribute to discussions, ask insightful questions, and share information effectively
- Continuously learn and challenge the status quo, always seeking innovative ways to improve our processes and offerings
4. In It Together
Last but certainly not least, we believe in the power of collaboration, mutual support, and compassion. This value underscores our commitment to fostering a positive, respectful work environment where everyone can thrive. "In It Together" means:
- Creating a collaborative work environment and showing respect to all team members and individuals
- Bringing colleagues and customers together to achieve better results and reach common goals
- Demonstrating honesty, transparency, and integrity in team settings
- Speaking openly but respectfully, always listening actively, and being present and ready to participate
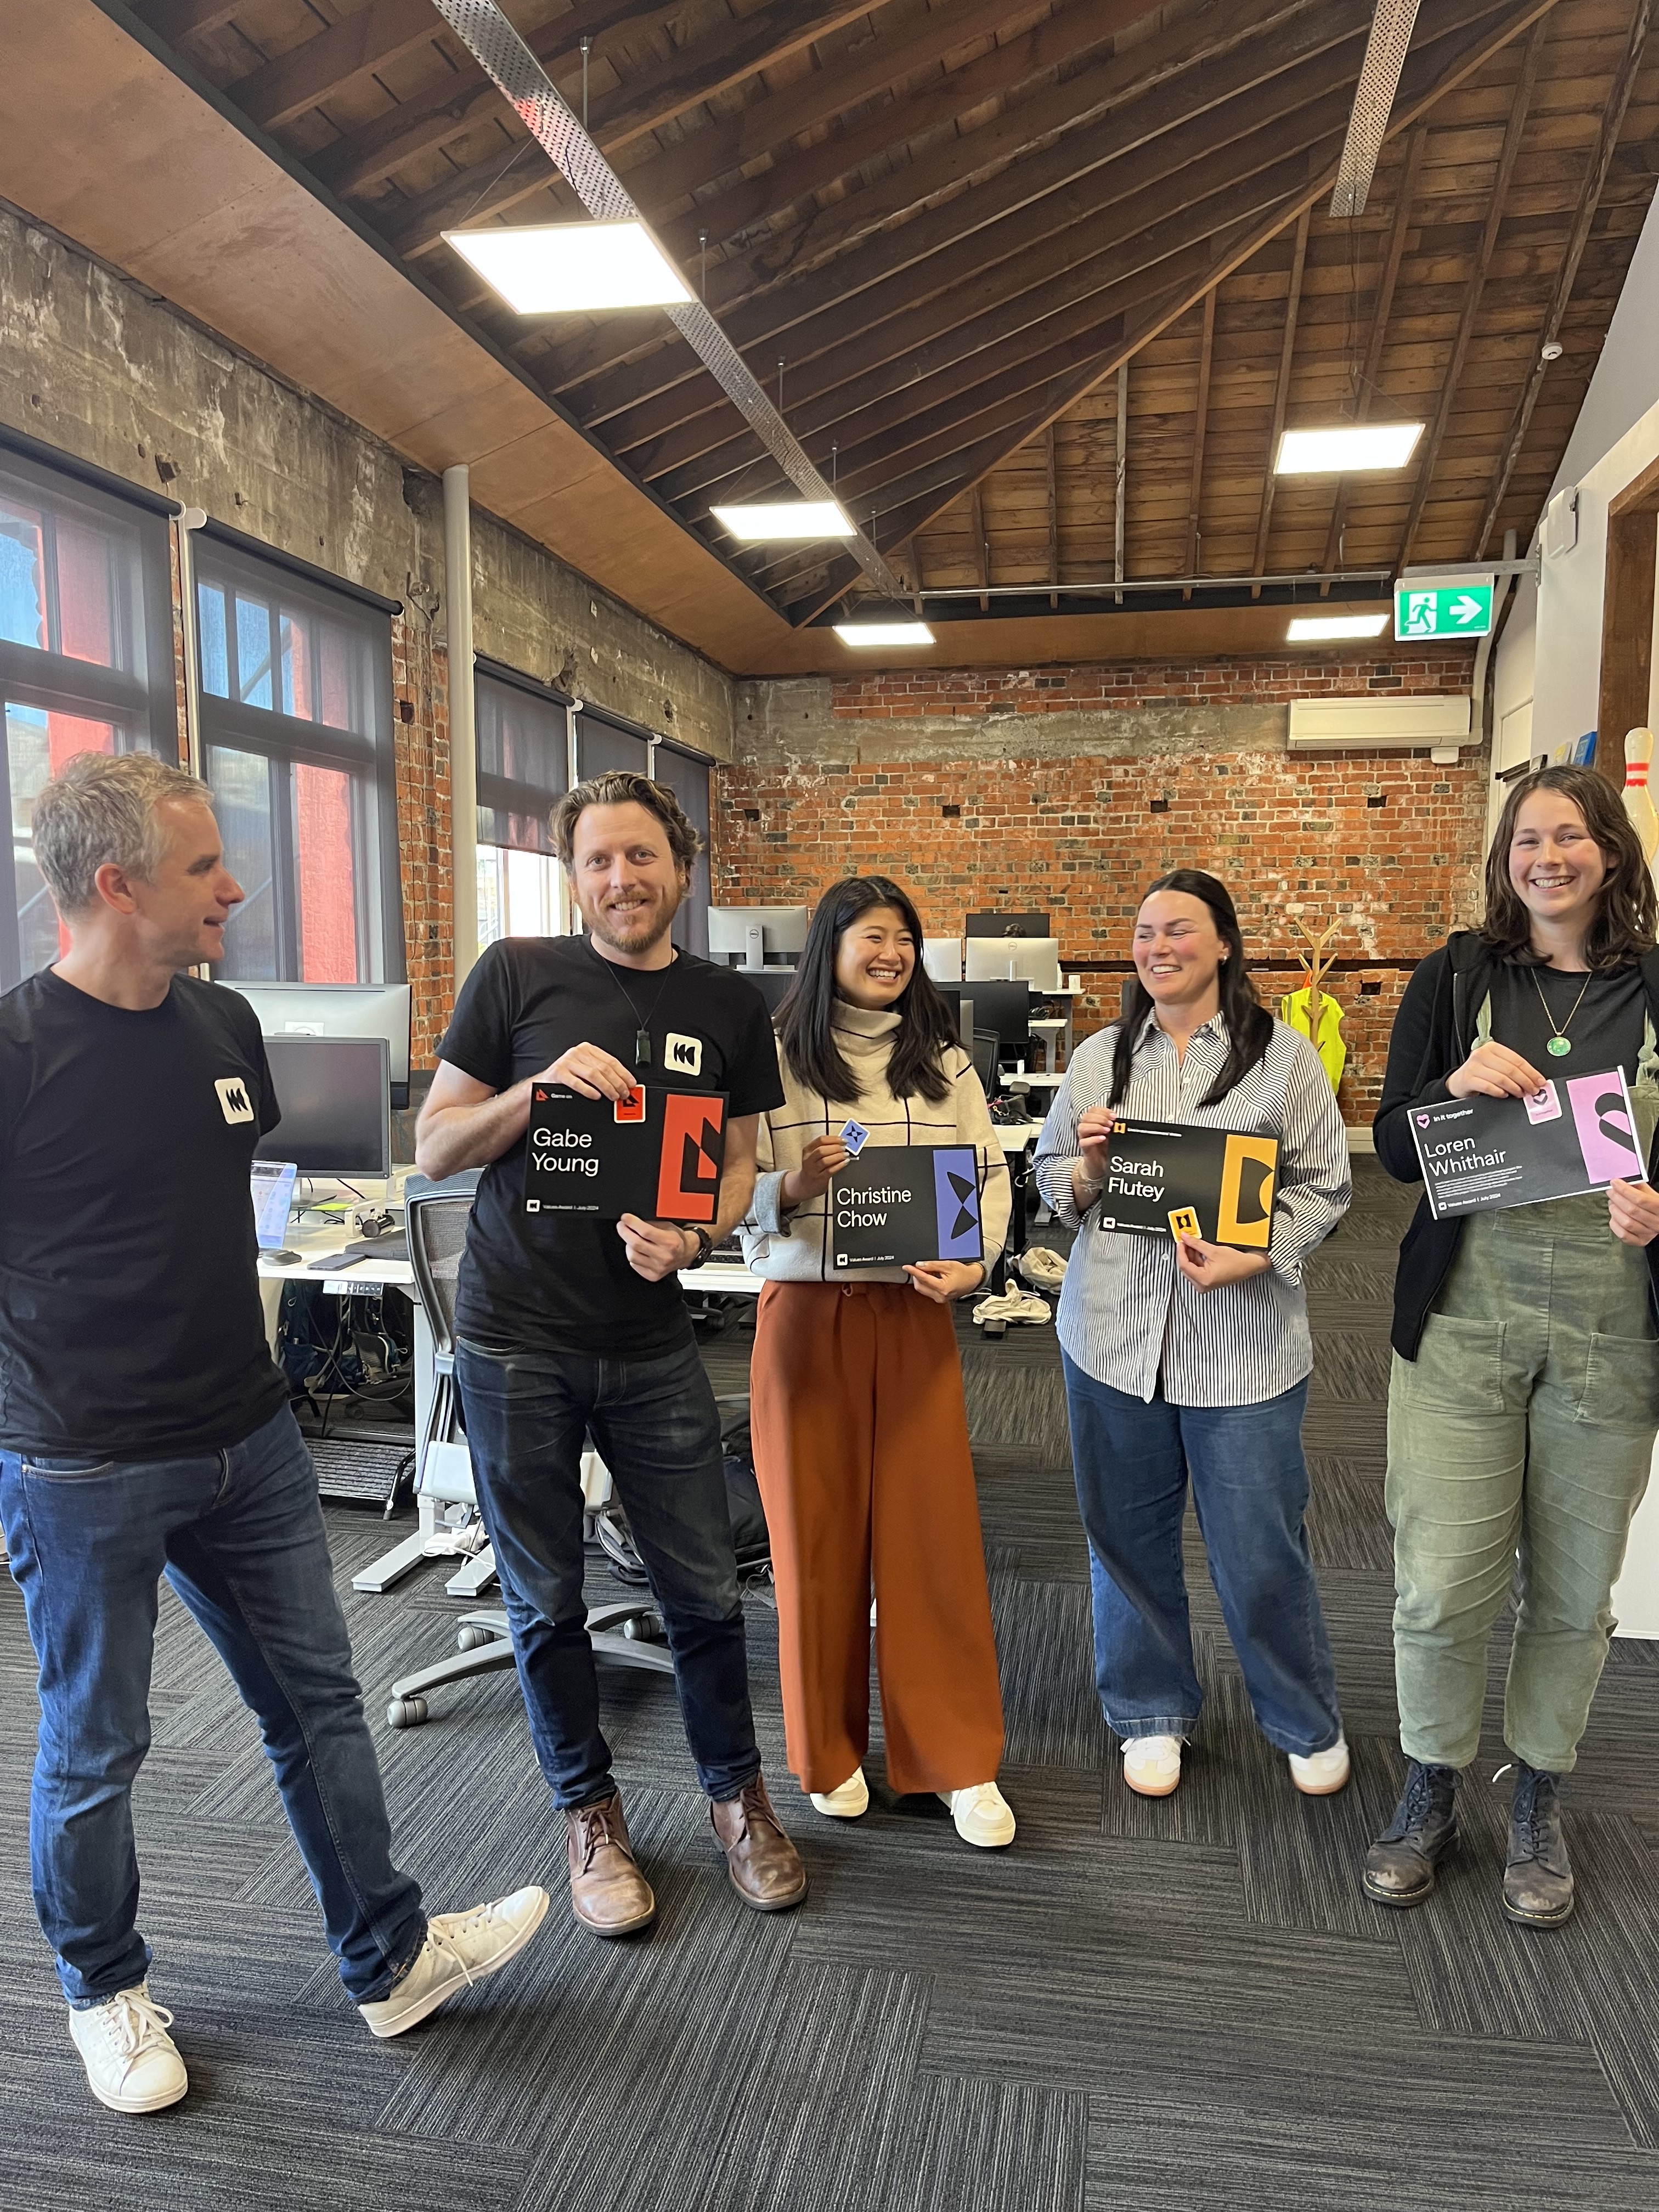
Celebrating our values in action 🥳
To bring these values to life, we recently celebrated our inaugural Value Awards. It was inspiring to see team members being recognized for exemplifying these principles in their daily work:
- GabeYoung, Head of Engineering for "Game On"
- Sarah Flutey, Head of Product Marketing for "Live in Our Customer's Shoes"
- Christine Chow, Senior Product Marketer for "Own It"
- Loren Whithair Senior Business Intelligence Advisor (Data) for "In It Together"
These winners have set a great benchmark for all of us to follow, showing how our values translate into tangible actions and outcomes.
Looking ahead 🔭
One of the most crucial lessons I've learned as a CEO is the immense value of establishing clear core values and guidelines early in a company's journey. When these fundamental pieces are in place, scaling becomes not just easier, but significantly faster – especially when it comes to global growth.
By setting these core values and guidelines early, we've created a strong foundation that will enable Optimal Workshop to scale more efficiently and effectively on a global level, maintaining our identity, culture, and high standards of performance, no matter how large we become or how far we expand geographically.
Here's to the journey ahead – onwards and upwards, across borders and beyond!
Alex Burke