


At Optimal Workshop, we've always prided ourselves on being pioneers in the field of UX research tools. Since our inception, we've been the go-to platform for UX researchers and designers looking to conduct card sorting, tree testing, and other critical user research activities. Our tools have helped shape the digital experiences of some of the world's leading companies.
The digital landscape is ever-changing, and with it, the needs of the professionals who create and optimize digital experiences. As we've grown and evolved alongside the industry, we've recognized the need to expand our reach and refine our value proposition to better serve not just UX researchers, but all professionals involved in delivering exceptional digital experiences.
That's why we're excited to announce a significant brand refresh and value pivot for Optimal Workshop. This evolution isn't just about a new coat of paint – it's a fundamental shift in how we position ourselves and the value we provide to our users and the broader digital experience community.
Why fix it if it ain’t broke? 💔🔨
Expanding Our User Base
While we've built a strong reputation among UX researchers, we've recognized that there's a broader audience of professionals who benefit from our tools and expertise. Product managers, marketers, customer experience specialists, and others involved in shaping digital experiences often lack access to professional-grade user research tools or the knowledge to effectively implement them.
Our brand refresh aims to make Optimal Workshop more accessible and relevant to this wider circle of professionals, without losing the deep respect we've earned from UX experts.
Adapting to market changes
The UX research landscape has evolved significantly since we first entered the market. With the proliferation of prototyping tools and the increasing speed of digital product development, there's been a shift away from extensive upfront research. However, we firmly believe that incorporating the voice of the customer throughout the development process is more critical than ever.
Our pivot allows us to emphasize the importance of integrating user research and insights at various stages of the digital experience lifecycle, not just during initial design phases.
Leveraging our expertise
As pioneers in the field, we have accumulated a wealth of knowledge about best practices in UX research and digital experience optimization. Our brand refresh positions us not just as a tool provider, but as a trusted partner and thought leader in the industry. We're doubling down on our commitment to sharing knowledge, standardizing best practices, and elevating the work of exceptional practitioners in the field.
Meeting evolving business needs through effective UX
The UX industry is evolving rapidly, with increasing investment and a diverse range of roles getting involved. From junior designers leveraging AI to seasoned researchers with deep expertise, the landscape is rich with talent and tools. However, the true value lies in how effectively these resources translate into business outcomes.
Optimal Workshop recognizes that exceptional digital experiences are no longer just nice-to-have – they're critical for engagement, conversion, and overall business success. Our tools bridge the gap between UX insights and tangible ROI by:
- Democratizing research: Enabling teams across experience levels to gather valuable user data quickly and efficiently.
- Accelerating decision-making: Providing fast, actionable insights that reduce design iterations and time-to-market.
- Enhancing team effectiveness: Facilitating collaboration and knowledge sharing between junior and senior team members.
- Driving business value: Directly linking UX improvements to key performance indicators and bottom-line results.
In a landscape where basic UX practices are becoming table stakes, Optimal Workshop empowers organizations to go beyond the basics. We help teams leverage the full spectrum of UX expertise – from AI-assisted analysis to seasoned human insight – to create digital experiences that truly set businesses apart and deliver measurable returns on UX investment.
What's changing at Optimal Workshop 🐛🦋
1. Best-in-class research & insights platform
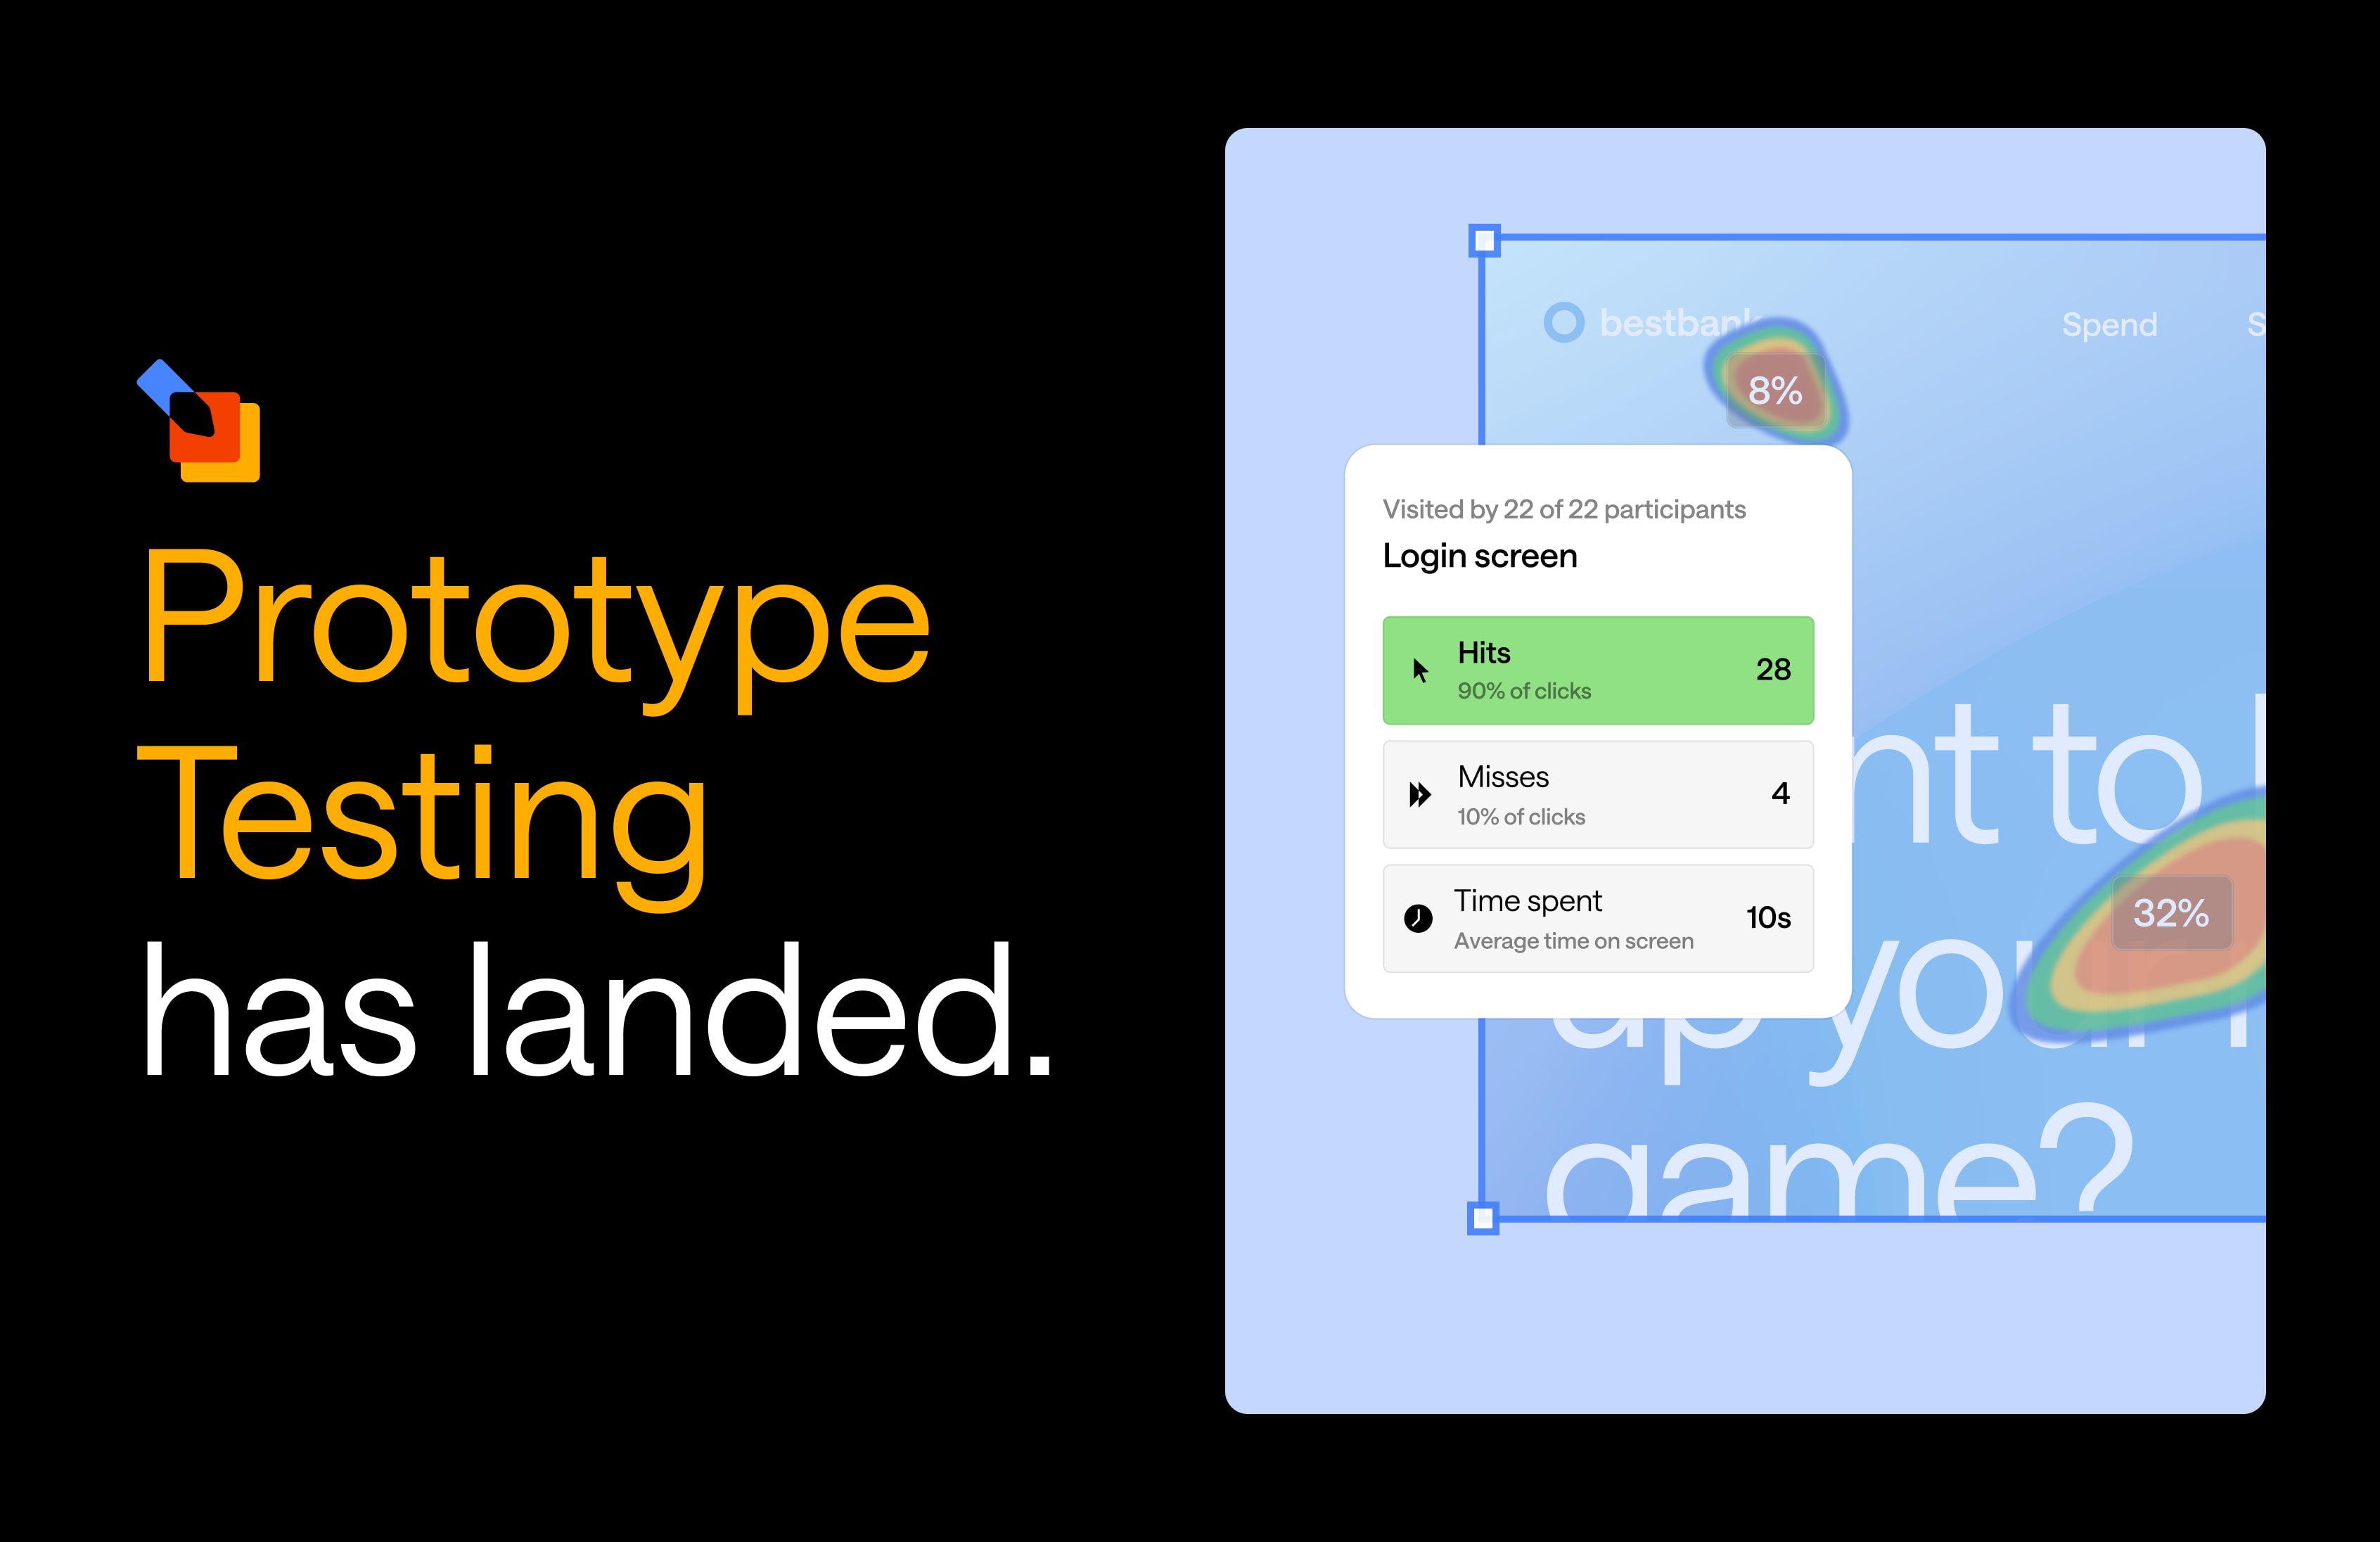
While our core tools remain a critical part of our offering, we're broadening our focus to position Optimal Workshop as a best-in-class research & insights platform for digital experience professionals. This means developing new tools, workflows, and integrations that cater to a wider range of use cases and user types.
2. Accessibility without compromise
We're committed to making our professional-grade tools more accessible to a broader audience without sacrificing the depth and rigor that our expert users expect. This means developing new onboarding experiences, creating more intuitive interfaces, and providing educational resources to help users at all levels get the most out of our platform.
3. Championing best practices
As part of our evolution, we're placing a greater emphasis on identifying, sharing, and standardizing best practices in digital experience research and optimization. Through case studies, partnerships with industry leaders, and our own thought leadership content, we aim to elevate the entire field of digital experience design.
4. Fostering a community of excellence
We're doubling down on our commitment to building and nurturing a community of digital experience professionals. This includes expanding our educational offerings, hosting more events and webinars, and creating opportunities for our users to connect and learn from each other.
5. Emphasizing outcomes and ROI
We're aligning our messaging and product development with the real-world impact our users are seeking. That’s why the new names for our tools emphasize what each tool helps you achieve, rather than the technical methodology behind it. This outcome-focused approach helps users quickly identify which tool is right for their specific needs.
How our evolution benefits you 🚀
For our long-time users, rest assured that the tools and features you know and love aren't going anywhere, but their names are changing to plain English terms to be more approachable for professionals who may not have a background in UX research. In fact, our UXR platform is only going to get better as we invest in improvements and new capabilities. You'll also benefit from an expanded community of practitioners and a wealth of new resources to help you continue to grow and excel in your field.
For professionals who may be new to Optimal Workshop or to formalized user research in general, our refresh means it's easier than ever to get started with professional-grade tools and methodologies. We're here to support you at every step, from your first card sort to building a comprehensive, data-driven approach to optimizing digital experiences.
Join us in shaping tomorrow's digital experiences 🌟
This brand refresh and value pivot mark an exciting new chapter for Optimal Workshop. We're committed to continuing our tradition of excellence while expanding our reach and impact in the world of digital experiences.
As we move forward, we'll be rolling out new features, resources, and initiatives that align with our refreshed brand and value proposition. We're excited to partner with our users – both new and long-standing – to push the boundaries of what's possible in creating truly exceptional digital experiences.
Thank you for being part of the Optimal Workshop community. Whether you're a UX research veteran or just starting your journey in optimizing digital experiences, we're here to support you with the best tools, knowledge, and community in the industry. Together, we can shape the future of digital experiences and make the online world more intuitive, efficient, and enjoyable for everyone.
Onwards and upwards,
Alex Burke, CEO Optimal Workshop