6 tips for making the most of Reframer

Summary: The notetaking side of qualitative research is often one of the most off-putting parts of the process. We developed Reframer to make this easier, so here are 6 tips to help you get the most out of this powerful tool.
In 2018, a small team at Optimal Workshop set out to entirely revamp our approach of providing learning resources to our users and community. We wanted to practice what we preached, and build a new blog website from the ground up with a focus on usability and accessibility. As you can probably imagine, this process involved a fair amount of user research.
While we certainly ran our fair share of quantitative research, our primary focus was on speaking to our users directly, which meant carrying out a series of user interviews – and (of course) using Reframer.
There’s really no overselling the value of qualitative user research. Sure, it can be off-putting for new researchers due to its perceived effort and cost, but the insights you’ll gain about your users can’t be found anywhere else.
We knew of the inherent value in qualitative research, but we were also aware that things like interviews and usability testing would be put off due to the time required to both carry out the tests and time spent hours in workshops trying to pull insights out of the data.
So, with that in mind, here are 6 tips to make the most out of our recently released from beta tool, Reframer!
1. How to create good observations
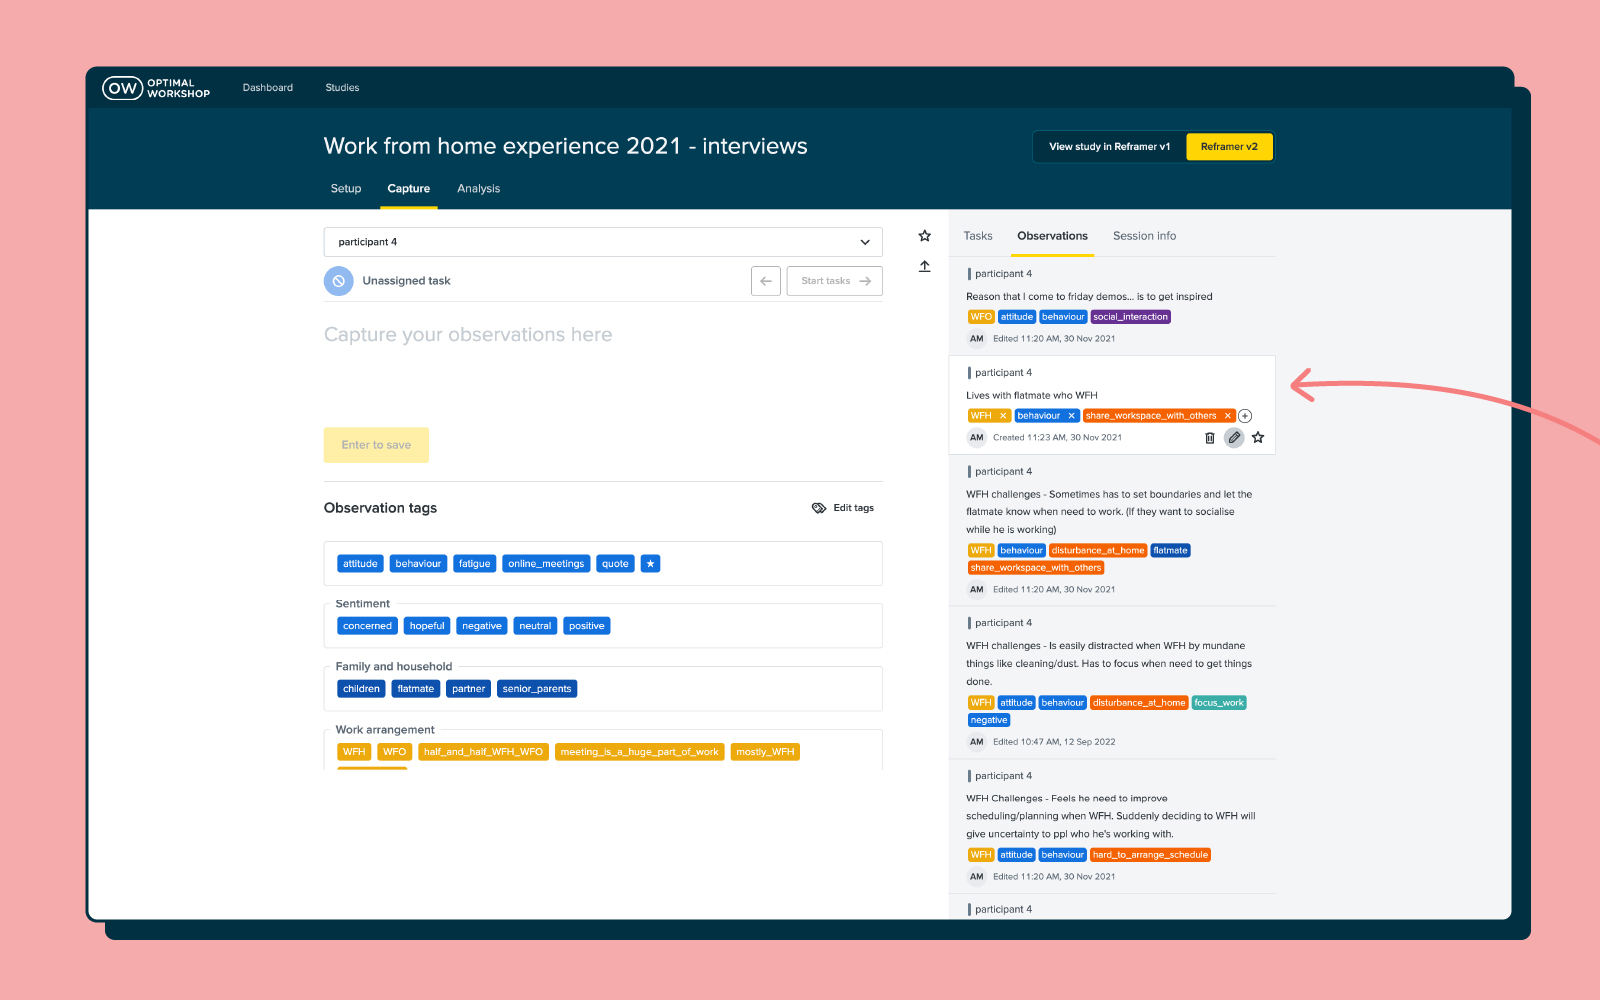
Observations are a core piece of the puzzle when it comes to effectively using Reframer. Observations are basically anything you see or hear during the course of your interview, usability test or study. It could be something like the fact that a participant struggled with the search bar or that they didn’t like the colors on the homepage.
Once you’ve collected a number of observations you can dive into the behaviors of your users and draw out patterns and themes – more on this further on in the article.
As for creating good observations using Reframer, here are a few tips:
- Record your sessions (audio or video): If you can, record the audio and video from your session. You’ll be able to listen or watch the session after the fact and pick up on anything you may have missed. Plus, recordings make for a good point of reference if you need to clarify anything.
- Note down timestamps during the session: Make a note of the time whenever something interesting happens. This will help you to jump back into the recording later and listen or watch the part again.
- Write your observations during the session: If you can’t, try and write everything down as soon as the session finishes. It’s a good idea to ask around and see if you can get someone else to act as a notetaker.
- Make a note of everything – even if it doesn’t seem to matter: Sometimes even the smallest things can have a significant impact on how a participant performs in a usability test. Note down if they’re having trouble with the keyboard, for example.
2. Tips for using tags correctly
The ability to tag different observations is one of the most powerful aspects of Reframer, and can significantly speed up the analysis side of research. You can think of tags as variables that you can use to filter your data later. For example, if you have a tag labeled “frustrated”, you can apply it to all of the relevant observations and then quickly view every instance when a participant was feeling frustrated after you’ve concluded your test.
When it comes to user interviews and usability tests, however, there are a couple of things to keep in mind when tagging.
For user interviews, it’s best not to apply tags until after you’ve finished the session. If you go and preload in a number of tags, you’ll likely (if unintentionally) introduce bias.
For usability tests, on the other hand, it’s best to set up your tags prior to going into a session. As just one example, you might have a number of tags relating to sentiment or to the tasks participants will perform. Setting up these types of tags upfront can speed up analysis later on.
If there’s one universal rule to keep in mind when it comes to Reframer tags, it’s that less is more. You can use Reframer’s merge feature to consolidate your tags, which is especially useful if you’ve got multiple people adding observations to your study. You can also set up groups to help manage large groups of tags.

3. After a session, take the time to review your data
Yes, it’s tempting to just shut your laptop and focus on something else for a while after finishing your session – but here’s an argument for spending just a little bit of time tidying up your data.
The time straight after a session has finished is also the best time to take a quick pass over your observations. This is the time when everything about the interview or usability test is still fresh in your mind, and you’ll be able to more easily make corrections to observations.
In Reframer, head over to the ‘Review’ tab and you’ll be presented with a list of your observations. If you haven’t already, or you think you’ve missed some important ones, now is also a good time to add tags.
You can also filter your observations to make the process of reviewing data a little easier. You can filter by the study member who wrote the observation as well as any starred observations that study members have created. If you know what you’re looking for, the keyword search is another useful tool.
Taking the time to make corrections to tags and observations now will mean you’ll be able to pull much more useful insights later on.
4. Create themes using the theme builder
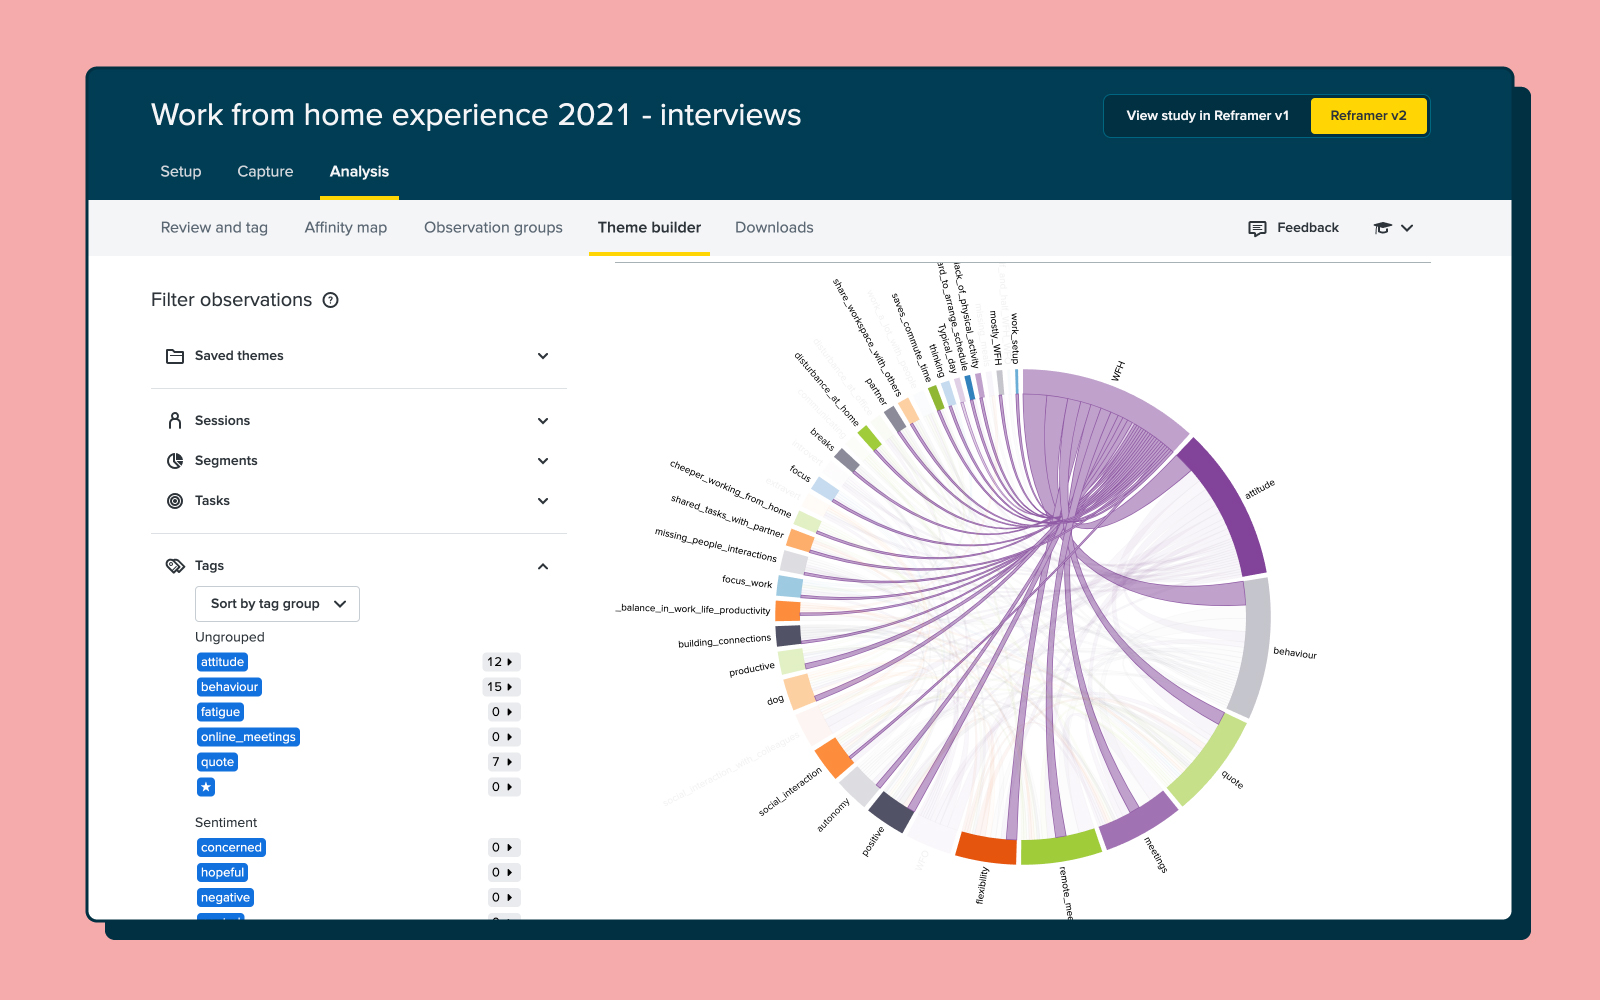
With all of your observations tidied up and tags correctly applied, it’s time to turn our attention to the theme builder. This is one of the most powerful parts of Reframer. It allows you to see all of the different relationships between your tagged observations and then create themes based on the relationships.
The really neat thing with the theme builder is that as you continue to work on your study by feeding in new observations, the top 5 themes will display on the Results Overview page. This means you can constantly refer back to this page throughout your project. Note that while the theme builder will update automatically, it’s best to tag as many observations as possible to get the most useful data.
You can read a detailed guide of how to actually create themes using the theme builder in our Knowledge Base article.
5. Take advantage of Reframer’s built-in visualization functionality
So, whether your experience with Reframer starts with this article or you’ve already had a play around with the tool, it should be clear that tags are important. This functionality is really what enables you to get the kind of analysis and insight that you can out of your data in Reframer.
But you can actually take this a step further and transform the data from your tagging into visualizations – perfect for demonstrating your results to your team or to stakeholders. There are 2 visualization options in Reframer.
First of all, there’s the chord diagram. As you can see from the picture below, the chord diagram allows you to explore the relationships between different tagged observations, which in turn helps you to spot themes. The different colored chord lines connect different tag nodes, with thicker lines representing the more times 2 tags appear on the same observation. Again, the more data you have (observations and tags), the richer or more in-depth the visualization.

The bubble chart is a little different. This visualization simply shows the frequency of your tags as ‘bubbles’ or circles. The larger the bubble, the more frequently that tag appears in your observations.
6. Import all of your qualitative research notes
Reframer works best when it’s used as the one repository for all of your qualitative research. After all, we designed the tool to replace the clutter and mess that’s typically associated with qualitative research.
You can easily import all of your existing observations from either spreadsheets or text documents using the ‘Import’ function. It’s also possible to just enter your observations directly into Reframer at any point.
You’ll likely find that by using Reframer in this way, there’ll be little chance of you losing track of research data over time. One of the biggest issues for research or UX teams is information loss when someone leaves the organization. Keep everything in Reframer, and you can avoid that loss of data if someone ever leaves.
Wrap-up
While quantitative research is often considered easiest to wrap your head around, qualitative research is also well-worth adding into to your workflow to ensure you're seeing the whole picture as you make important design decisions. This article is really just a surface-level overview of some of the neat things you can do with Reframer. We’ve got some other articles on our blog about how you can best use this tool, but the best place to really dig into the detail is in the Optimal Workshop Knowledge Base.

