New release: Test any website or web app. No code needed.
Learn more
The Participants table displays useful information about every participant who started your first-click test, and can be used to narrow and broaden the range of data you want to analyze.
You can use the participants table to:
You can do any of these things any time during your analysis, but we certainly recommend weeding out the ‘off’ or suspicious responses before conducting your analysis. If you plan to analyze data from different demographics separately, then you’d begin each demographic analysis at the Participant table.
If you’re interested in segmenting your results in the participants table based on answers to these questions, visiting the Questionnaire results first will help you spot the potentially significant and interesting patterns.
Here’s where you can see how participants responded to your pre and post study questions overall. If you’ve asked questions with multi-choice answers, you’ll see a bar graph, percentages of participants, and number of participants who selected each answer.
In our study we were interested in comparing the responses of people who were students (29%) to those who weren’t (71%).

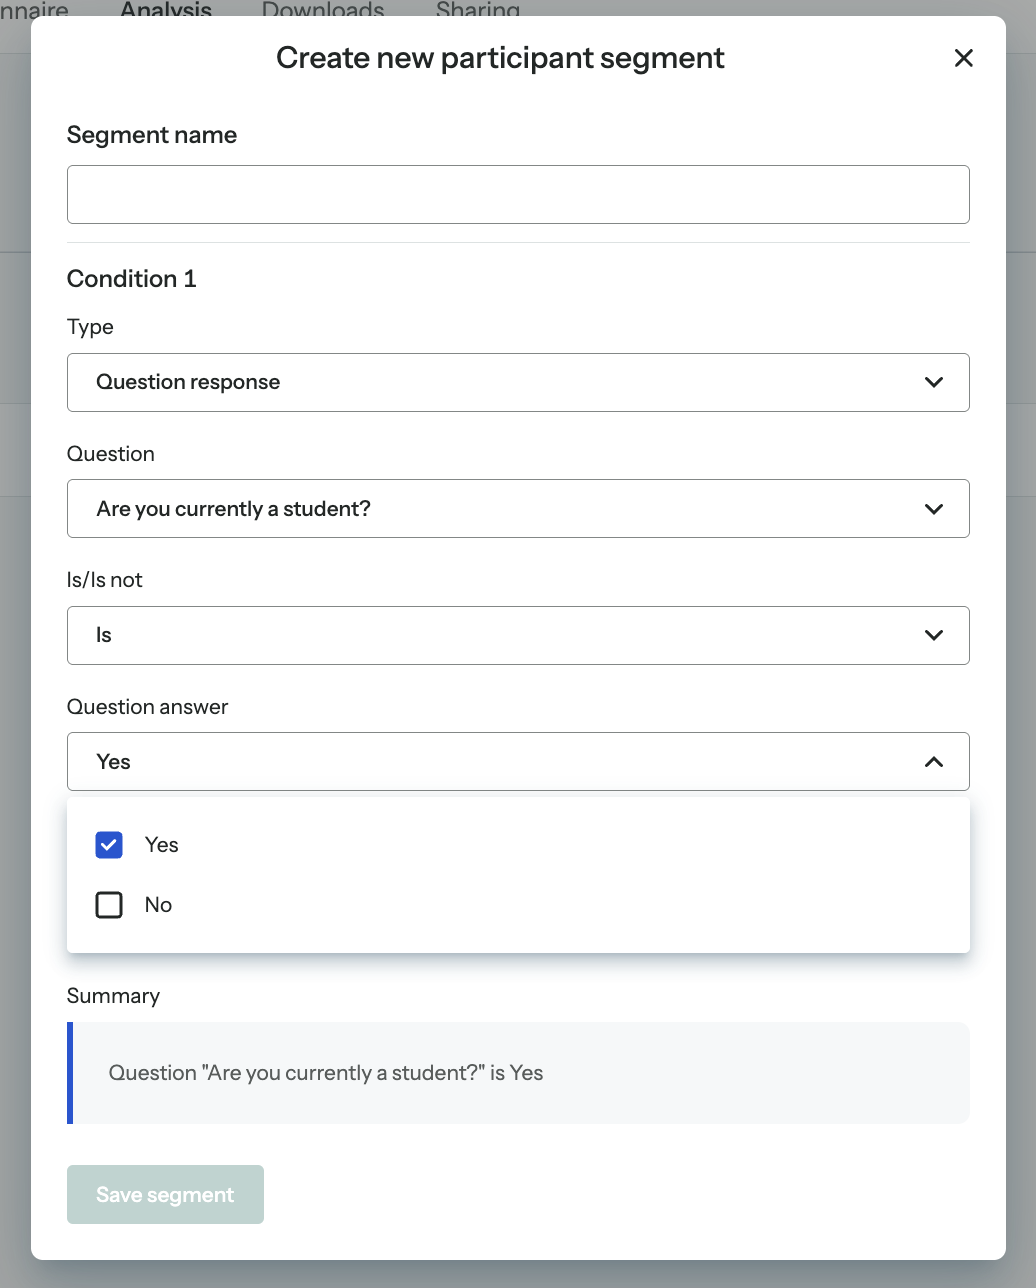
To do this, we segmented the participants by whether or not they were a student, starting with those who answered ‘yes’. We selected them using the filter and then reloaded the results. Once we’d analyzed that group, we went back and reloaded the results to show the group that answered ‘no’.
To compare like with like, we looked at the same task, and used the same clickmap type, the selection view. We found there were a few small differences between the two groups, 16% of students clicked on ‘student banking’ rather than ‘explore checking solutions’ or ‘Bank of America advantage banking’ but mostly the two groups were very similar:
Students:

Non students:
