New release: Test any website or web app. No code needed.
Learn more
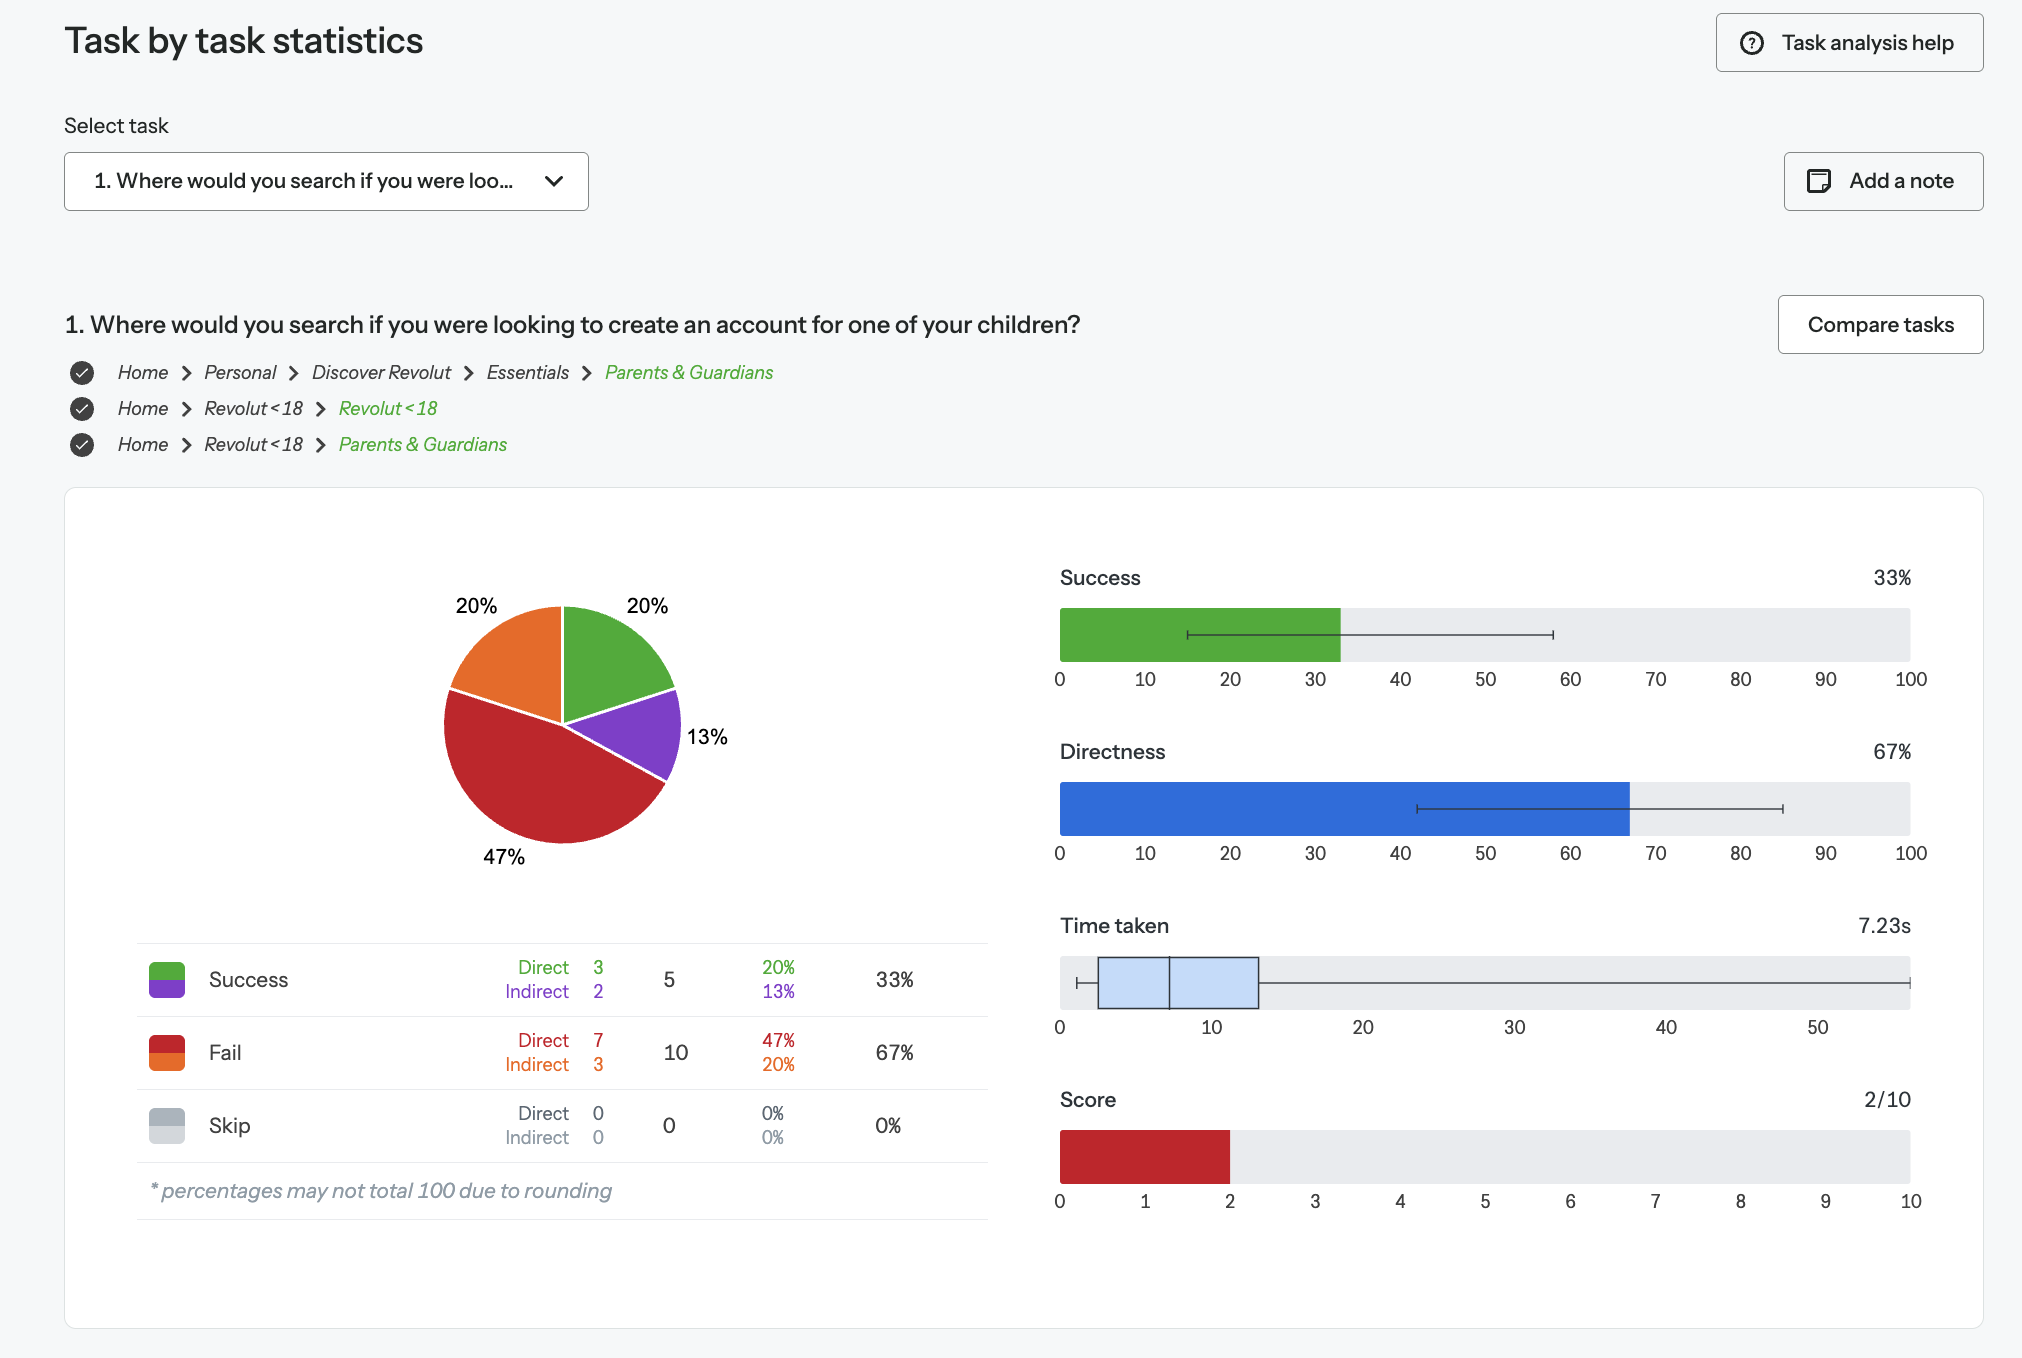
The Task results tab is where you can pinpoint the most significant results using the task, pietree and task comparison visualizations.
Let’s take a look at how to interpret the different parts of the Task results tab.
This is the total percentage of participants that navigated to the correct destination.
You can see this in the success score bar on the right hand side and divided into green and purple in the pie chart on the left (we’ll get into the meaning behind the colors soon).The black line with end bars on the success score is called an error bar. The error bar indicates the confidence in the success score. When you have only a handful of participants the error bar will likely be large. Lots of results for a task will reduce the bar to something very short. We use the Adjusted Wald method to calculate the error.
The overall success score is then divided, on the pie chart, into direct success and indirect success.
This is the number and percentage of participants who navigated to the correct destination via the correct path. In the example above, you can see that 71% of participants navigated to ‘Make extra payment’ (the correct destination) via the path we defined as correct (Home > Personal loan > Make extra payment). A high direct success percentage means that your labels are clear and make sense.
Indirect success (purple)
This is the number and percentage of participants that landed on the correct destination, but didn’t get there via the correct path. For example, we can see that 14% of participants ended up on ‘Make extra payment’, but they started down another path before realizing it wasn’t correct and backtracking. If the indirect success percentage is high, it means that participants know more or less what they’re looking for, but they don’t immediately spot a path to get there.
This is the total percentage of participants who took the correct path to land on the correct destination, i.e. they didn’t move back through the tree at any point.
The higher your directness score, the more confident you can be that your participants were sure of their answers – they knew what you wanted them to find and exactly how (and where) to find it.
Comparing the success and directness scores
Looking at these two scores together can give you good insight into the clarity of your paths and destinations. For example, if you have a high success score but a low directness score, this might mean that your participants know what they’re looking for but are starting down the wrong path to find it. In this case, it’s a good idea to look deeper into the exact paths they’re starting down and where they’re backtracking.
Sometimes we see a particular category attracting lots of wrong clicks. Dave O’Brien, who was one of the creators of tree testing, once described these ‘wrong’ categories as ‘evil attractors’ and the name stuck. No matter what task you set, users seem to assume that the answer is inside the ‘evil’ category. Often these categories have such nebulous, mean-nothing names that users read whatever they want from them and assume what they are looking for must be in there. Work really hard to rid your structures of evil attractors! Conversely, there may be ‘saintly repellers’ – these are the correct categories that users never pick, or pick only after looking in pretty much every other category. In either case, think carefully about the label you have given that category that appears to be attracting the wrong clicks or repelling correct clicks.
This is the average amount of time (in seconds) it took participants to complete the task. This is the ‘median’ time and is represented by the line in the middle of the light blue box. Outliers greater than four standard deviations from the mean have been removed for the purposes of these calculations.
Using the ‘time taken’ measurement is helpful when you’re A/B testing. It can clearly show you if it’s taking participants longer to find a destination in one tree or another.
This is the weighted average of your success vs. directness score for each task. Basically, if your overall score is less than 7, you might like to dive a little deeper into the success and directness scores to see how they compare to each other. It could be that the success score is high, but the directness score is low, meaning it’s a good idea to go back over your labeling, paths or tasks.
This is the percentage of participants who nominated an incorrect destination.
If there are a number of participants who failed to find the correct destination, dive deeper into this data. If they didn’t go to the right place, where did they go? It’ll give you insight into whether or not your IA is confusing for people.
Direct fail (red)
This is the number and percentage of participants who navigated down a direct (or singular) path to an incorrect destination. This could tell you there are multiple places in your tree where participants believe they could find what they’re looking for, or there may be some confusion around labeling.
Indirect fail (orange)
This is the number and percentage of participants who started down a path, backtracked, then navigated down another path and still landed on an incorrect destination. Indirect fails are usually a sign of true confusion – the participant wasn’t really sure what they were looking for or where to find it, even after trying multiple paths.
This is the percentage of participants who clicked skip on a task before they selected a destination. When setting up your study, you can disallow participants from skipping tasks (Setup/Tasks/Options)
Direct skip (dark gray)
This is the number and percentage of participants who clicked the ‘skip’ button without even engaging with the tree. This is a good indicator of whether or not your tasks are clear and concise enough. If there are a number of direct skips on a particular task, perhaps people are unsure of what you’re asking of them and don’t feel confident navigating through the tree.
Indirect skip (light gray)
This is the number and percentage of participants who began to navigate through the tree before clicking the ‘skip’ button. This may indicate that once they got into the tree, they felt unsure of where to go next. Perhaps they didn’t see the type of labeling they expected or felt confused by what the tree displayed in comparison to what the task required of them.
Testing and comparing multiple variations of trees will help you nail down an effective navigation structure before you implement it, saving time and costly mistakes. Use the task comparison function to compare the same task across two different tree tests. This will show you quickly which tree is more findable and what areas might need to be improved.
Click the ‘Compare tasks’ button on your chosen task. Then select the study and task you want to compare it to. You’ll then get a clear view of which tree performed better.
In the example below, we’ve compared task 2 of two different tree testing iterations. You can see that the second tree test performed better, and participants were more likely to find the correct destination (though there is still room for improvement, as there is a big portion of indirect success).
