New release: Test any website or web app. No code needed.
Learn more
The Categories tab is a great doorway into your card sorting results. Spend a few minutes scanning the groups that people came up with and you’ll quickly form an impression of how they are thinking (how they perceived the overall theme or concept of your cards).
In an open card sort, the table displays all groups created by your participants and the cards they placed in each group. For a hybrid card sort, you’ll see the same, but with the addition of the categories you created as well. And in a closed card sort, you’ll obviously see just the categories you
pre-set.
Open and hybrid card sorts
You’ll explore your open and hybrid card sorting results to get ideas for labeling and grouping your information, so kick off your analysis with these questions in your head:
Standardizing your categories
Standardizing categories means merging similar categories together to turn them into one category.
In the first column of the Categories table, you’ll see a number of different categories that have been created. If it’s an open card sort, all the categories will be ones that your participants have created. If it’s a hybrid card sort, you’ll see the categories you created in bold with a blue line.
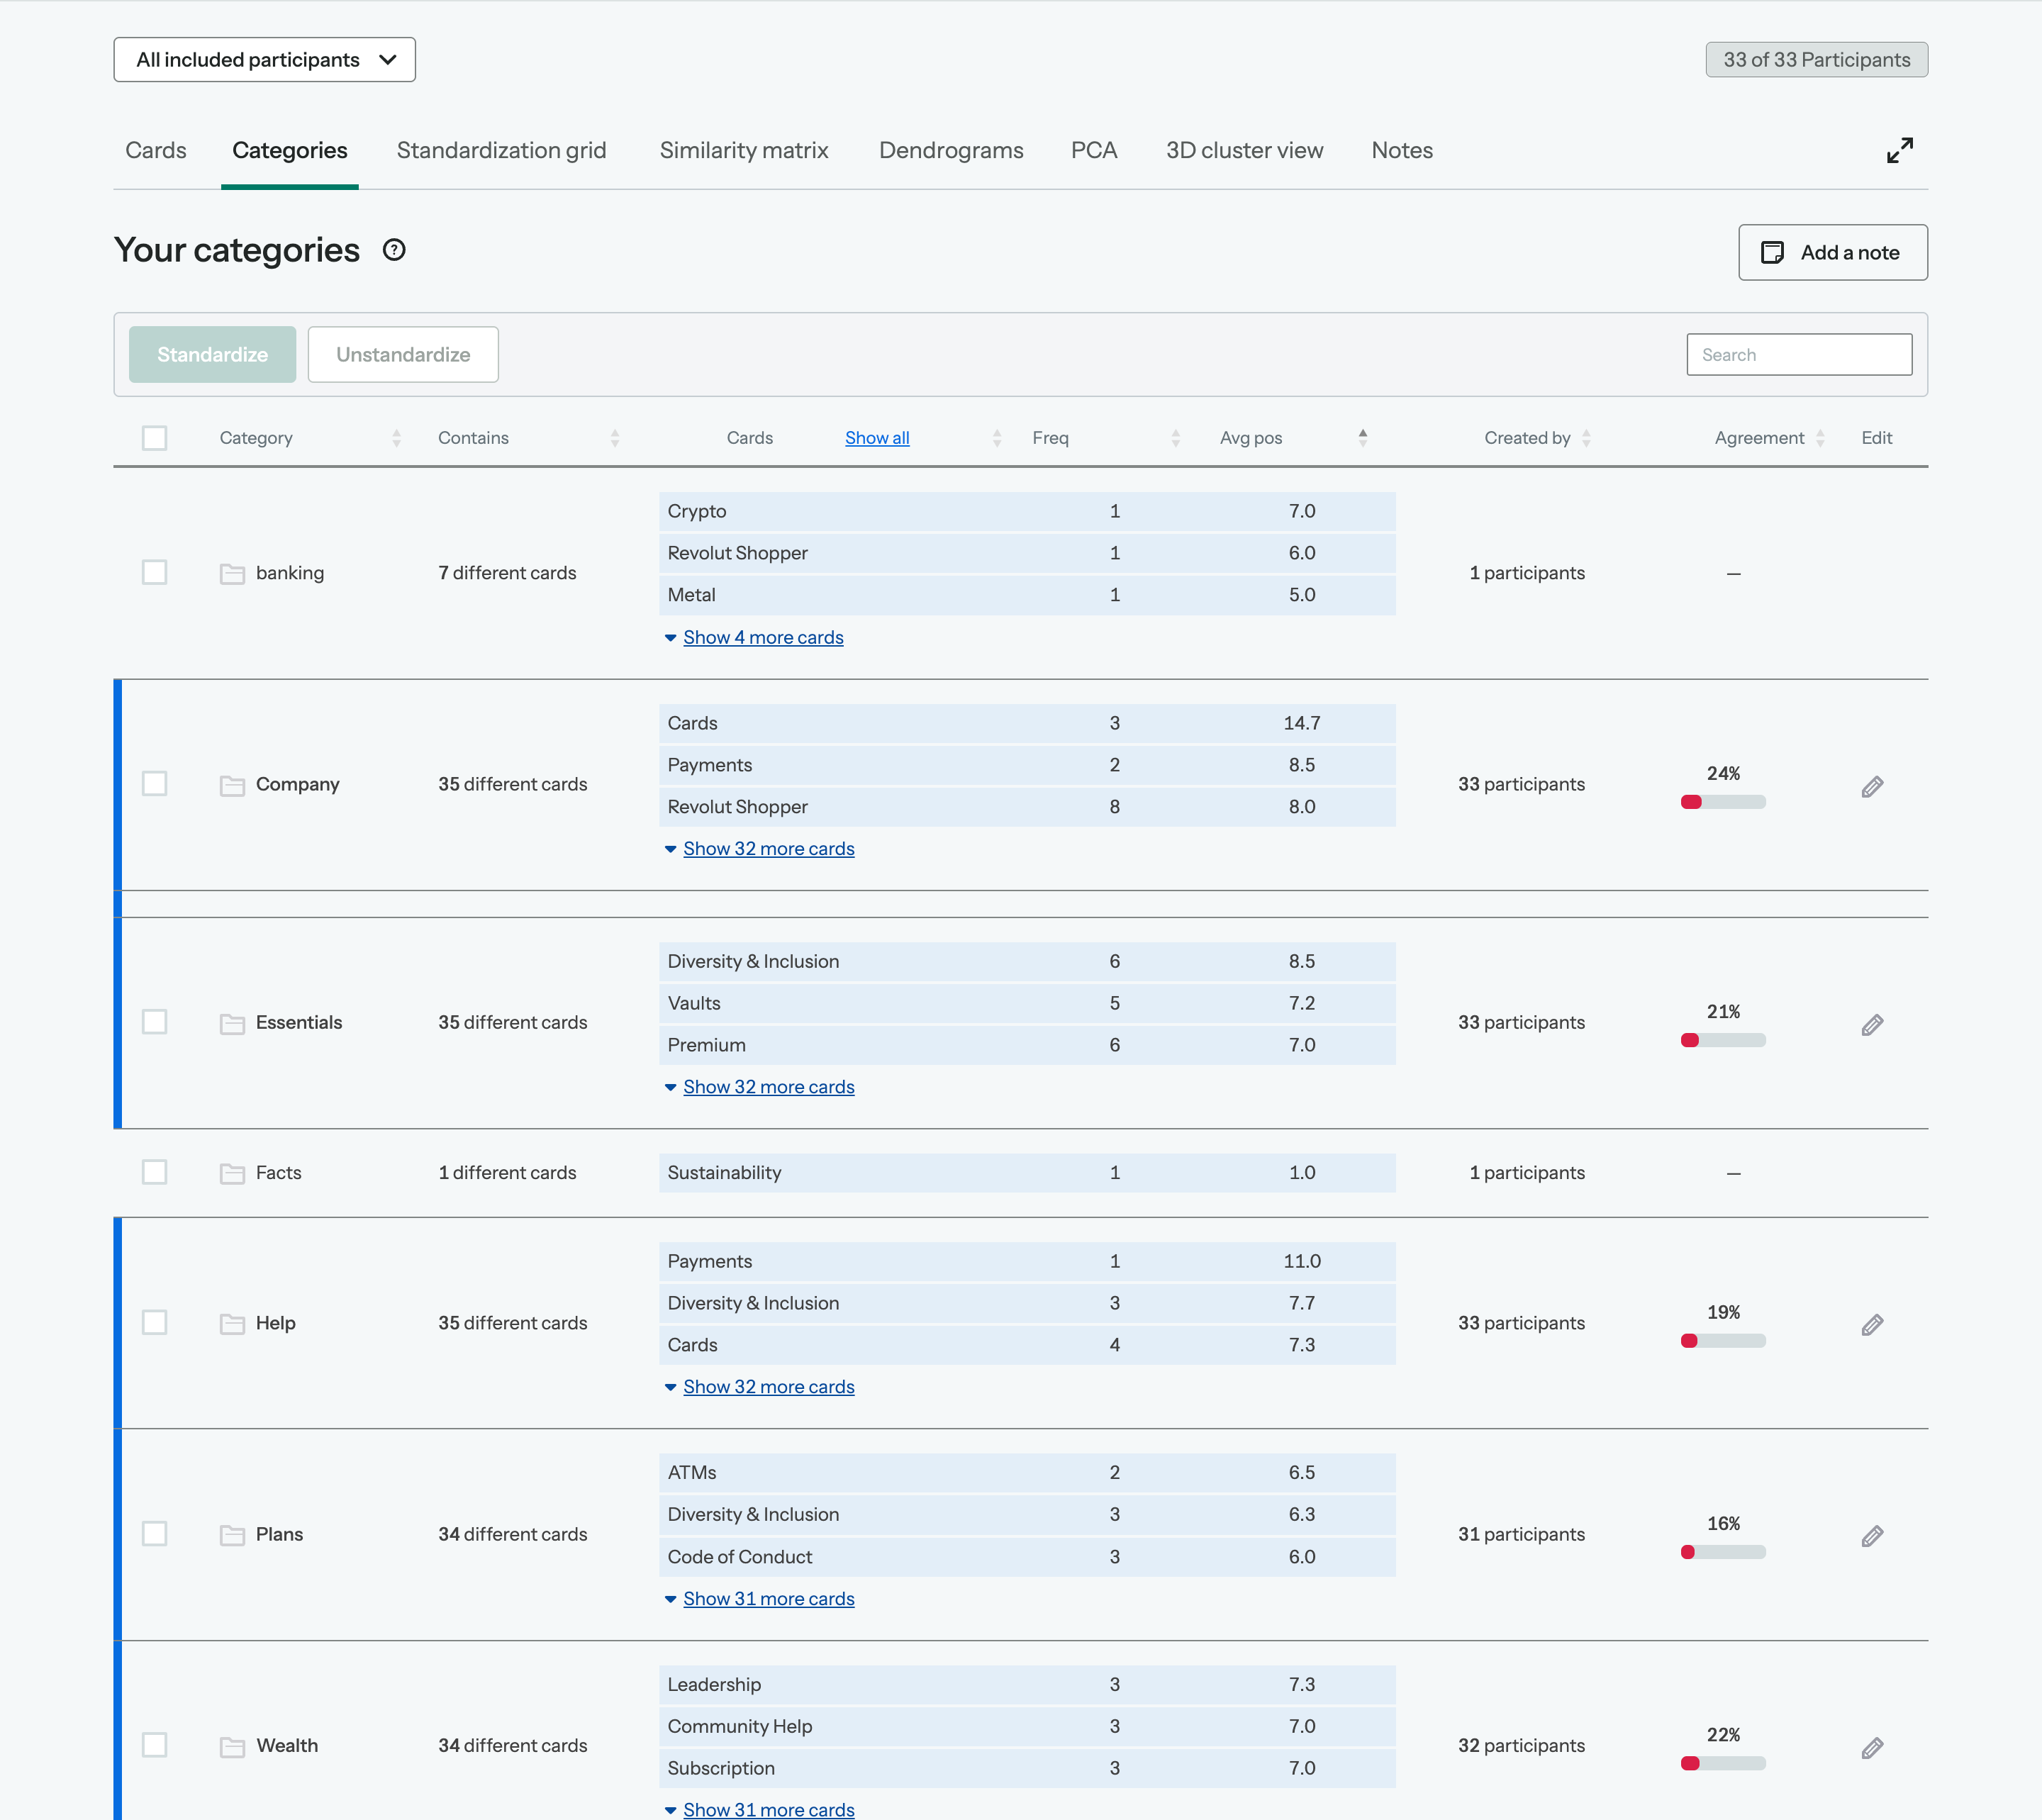
When you allow participants to come up with their own category names, there’s a good chance you’ll see similar labels that have variations in wording, spelling, capitalizations, and so on. Furthermore, when you take a closer look at the cards, you can often deduce that different participants mean exactly the same thing by their category labels.
Standardizing your categories is an optional activity; you don’t have to group all of the similar categories to be able to use the other visualizations that card sorting provides. Some researchers find standardizing an important activity to do as it means they actively engage with their users’ decisions. When merging categories they are forced to think about how users have created groups, what they have put in them and what mental models might exist to have driven those decisions.
If you are time-pressured or you prefer to rely on the other analysis visualizations, then not standardizing is an option. Just remember, that to get the best out of your card sort you need to think about how and why your users have sorted cards in the way they have, whichever visualizations you refer to.
Before you eye up a bunch of similar-looking labels and standardize straight away, it’s important to look at the similarities between the categories in more depth.
Here’s what we recommend:
Look for similar words or phrases: The categories table is initially arranged alphabetically, so you’ll be able to see similar categories next to each other by just glancing through the table. You can sort the table and the elements in the table rows, using the sort options at the top of the table columns. You can also use search to display only categories that contain keywords.
Establish if participants mean the same thing by their labels: If you find you’ve got a number of categories that have the same or similar labels, make sure you take a closer look before hitting ‘Standardize’. You want to ensure that the distinct categories you’re about to merge are similar enough to become one.
Two options for approaching this are:
Both approaches complement each other.
Check the agreement score of your standardized categories: As noted, when we place every category that uses the same words or phrases into a standardized category, we can assess the effectiveness of the category by looking at the agreement score.
The agreement score tells you the agreement level between the cards that participants placed in each category.
In an open card sort, you’ll see a dash in place of an agreement score before standardizing, as each category has only been created by one person.
Once you standardize a category, check the agreement score to get an objective assessment of how similar the groupings are. In the example below, we can see that the agreement score for standardizing “City info” and “City information” is 68%.
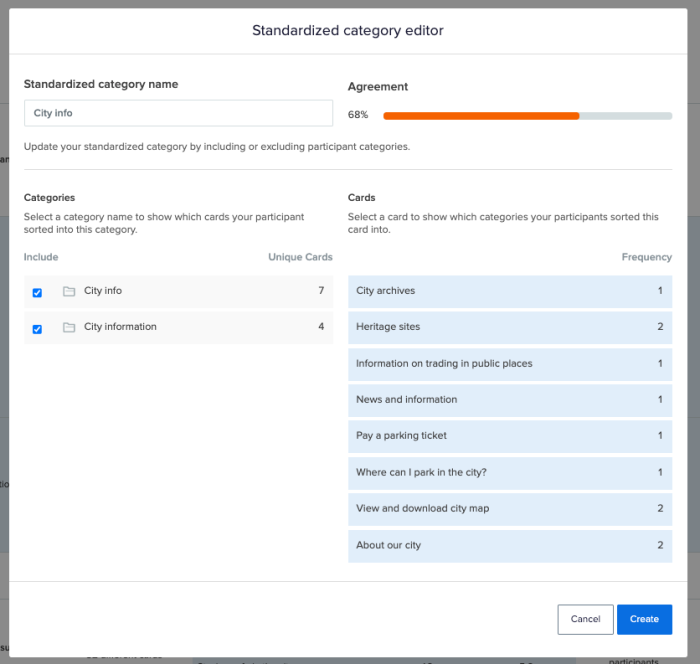
Any agreement score of over 60% generally means you’ll find it useful to keep this category standardized for the rest of your analysis.
In the example below, we can see that the agreement score is only 31%.

When you see an agreement score that’s low, it means that participants are probably thinking about the categories in different ways, or may have been less discriminating when making their categories. At this point, we could reassess our merged categories.
Closed card sorts
The Categories table for a closed card sort tells you how many times a card was sorted into each given category. You’ll also find out how many unique cards were sorted into each category, with fewer unique cards (cards in a category with a frequency greater than 1) meaning higher agreement among participants.
You’ll approach closed card sorting results with questions like:
With the closed card sort categories results, you could:
The example below shows us that there is high agreement for the top cards in this category. So it’s clear that the top five topics belong in the same category.

The “Community support and resources” category (below) had 24 cards sorted into it – the highest number of unique cards in one category. This suggests that the label itself was too broad, and therefore too ambiguous for our website.
Looking at the cards in the category, we can see there are a number of cards that were possibly ambiguous to participants. it pays to look into this. Perhaps if you split the group down into two or more groups would you get more agreement? If you have produced your cards by sampling items from your current site, are there cards that you left out that might be paired with the ambiguous cards?
Another possible reason for a high number of cards reported in one category is that you have overrepresented cards from a particular area of your current site or from the IA you are planning.

If you are conducting an open, or hybrid, card sort, you will see the Standardization grid tab. If you have standardized your groups in the Categories tab, head over there to see the effects of your work in more detail. The grid shows you, at a high level, the number of times a particular card appears in a standardized category.
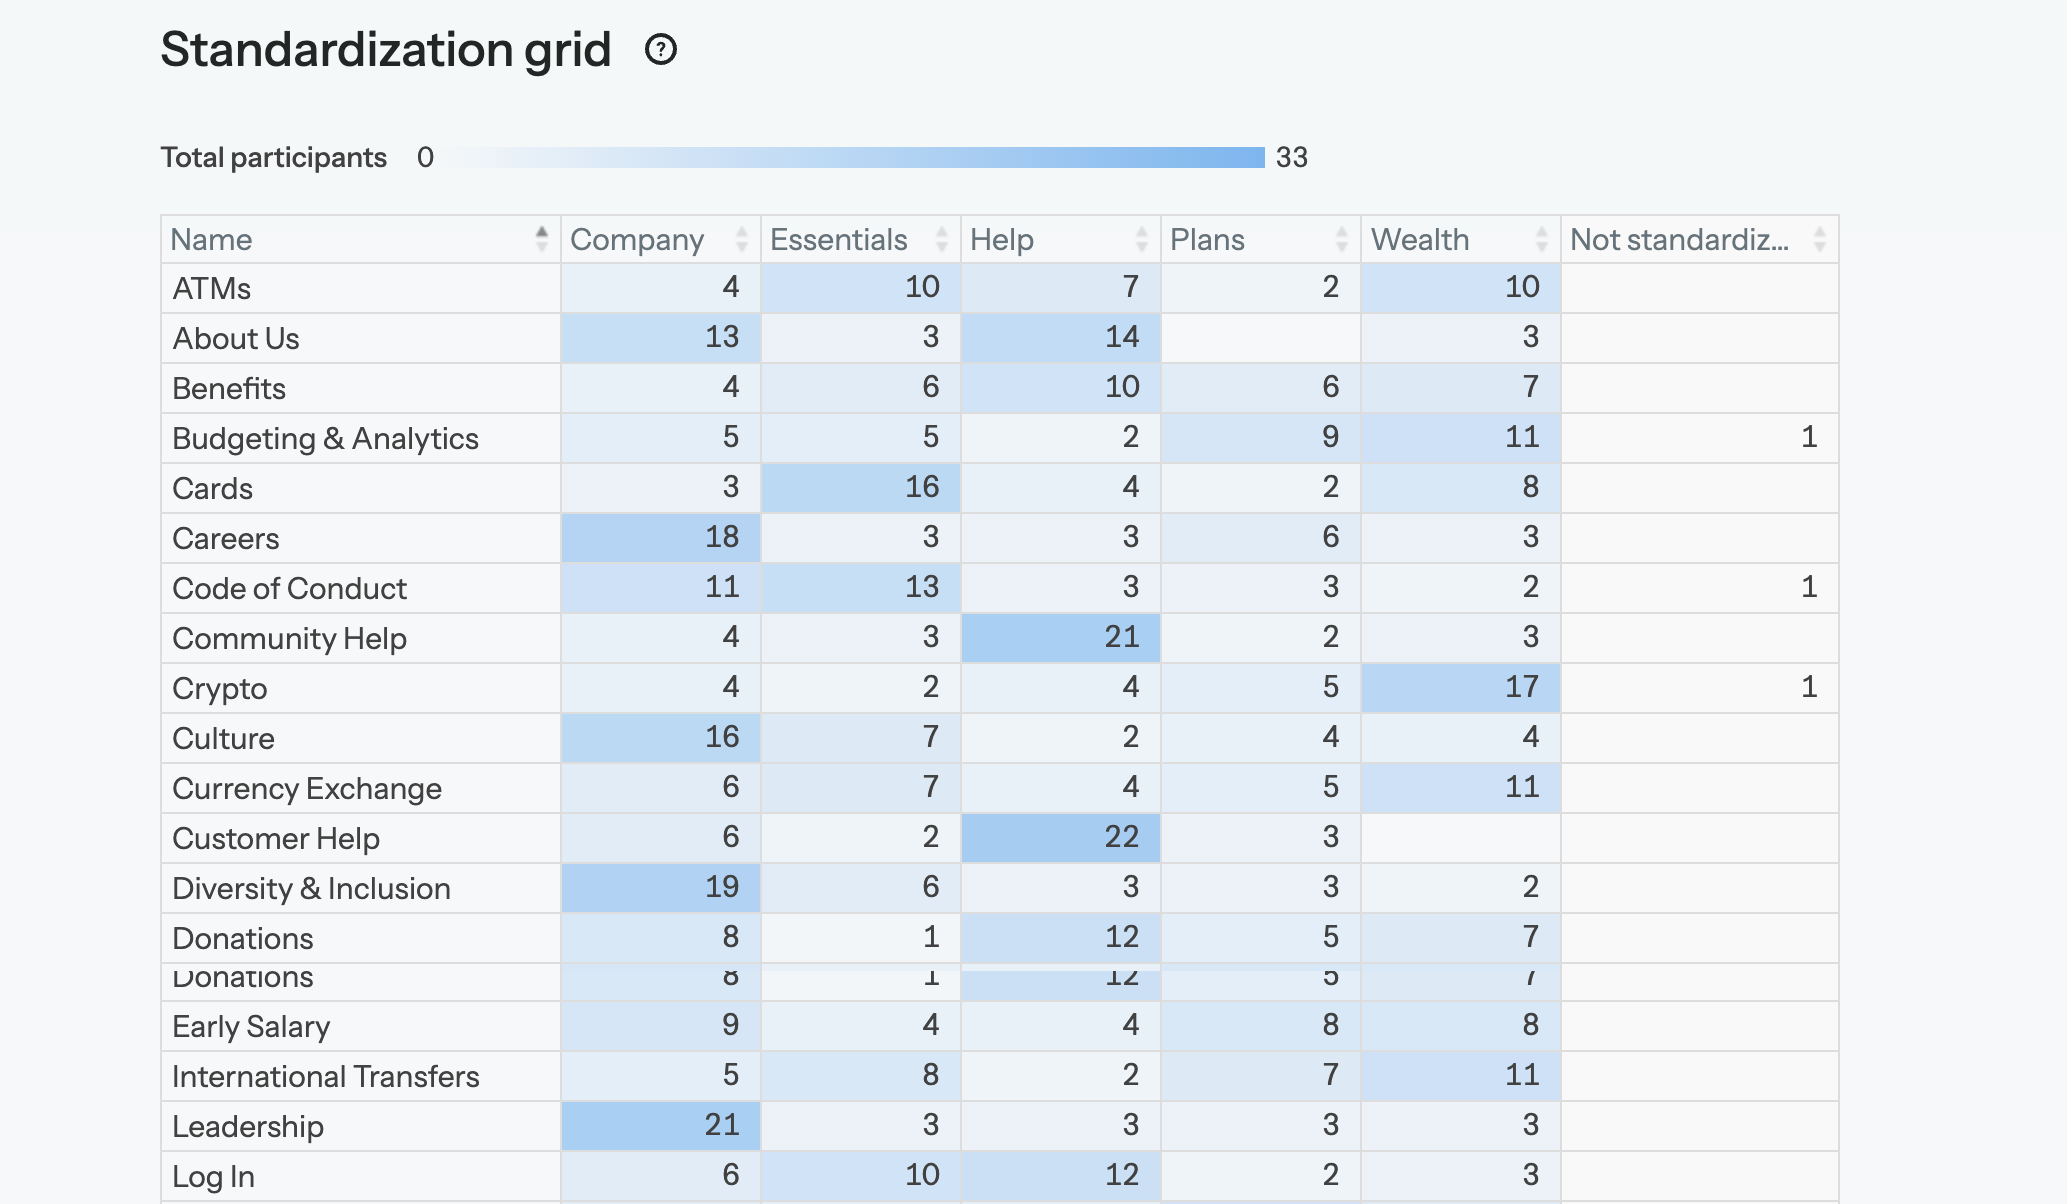
In the example above, you can clearly see the groups that were popular – the darker the blue, the more times a card appears in the group you have made by combining users’ groups. This means we can be more confident that these groups make sense to people, and they expect to find meaningful topics or content there.
The groups that don’t have much blue in them show us that people may have found these ambiguous or didn’t feel like any of the card topics belonged in these groups.
When you first land on the grid, it will be arranged alphabetically according to the card, but can rearrange it by highest to lowest, or lowest to highest for each group.
By sorting by highest card placing, you’ll get a quick view of which cards are strong contenders for that specific category.
Standardizing can take some time to do, if you have a lot of categories, so understanding the value to you of standardizing is important before you start.
Firstly , as noted above, when you standardize categories you get a clearer idea of the aggregations of cards that people are making. Basically, if the people whose groups you standardize were all sitting together, they’d be likely to say ‘I agree with what they said’. The small differences in opinion – ‘Products’ or ‘Our products’ melt away.
Secondly, when you standardize cards you affect what gets seen in some of the other visualizations – we’ll be talking about them later. If you standardize a lot of similar groupings it’s likely that when you look at the 3D Cluster view that the name you have used for the standardized category will be reported as one with ‘high agreement’. Your standardizing will also affect the category names shown when you mouse-over the Dendrogram on particular ‘branches’. Standardization does not affect the groupings presented in the Similarity Matrix, the Dendrograms, the Participant-centric analysis or the 3D Cluster view. It only affects the names of categories that might get recommended to you in the Dendrogram and 3D Cluster view.
Some of our customers express concern that by standardizing, they are somehow ‘silencing the voices’ of the people completing the card sort, as the researcher is applying their view ‘on top of’ the groupings made. This is a natural fear when conducting any research and emphasizing one fact or insight over another. We conduct research to help us make decisions. We make choices along the way that naturally affect what we learn and subsequently what we do.
Nevertheless, when standardizing groups that people have made, you are in fact amplifying voices that were previously singing alone, bringing those voices into a choir. In any case, should you feel that standardizing wasn’t for you, it can easily be undone through the ‘Unstandardize’ button.