New release: Test any website or web app. No code needed.
Learn more
The Cards tab shows you how each card was interpreted and categorized by your participants. You can see at a glance which cards were most commonly sorted into similar categories and which were split across different categories.
It can also help to identify where your participants agree, where they have different ideas and potentially if there were card labels that they didn’t understand.
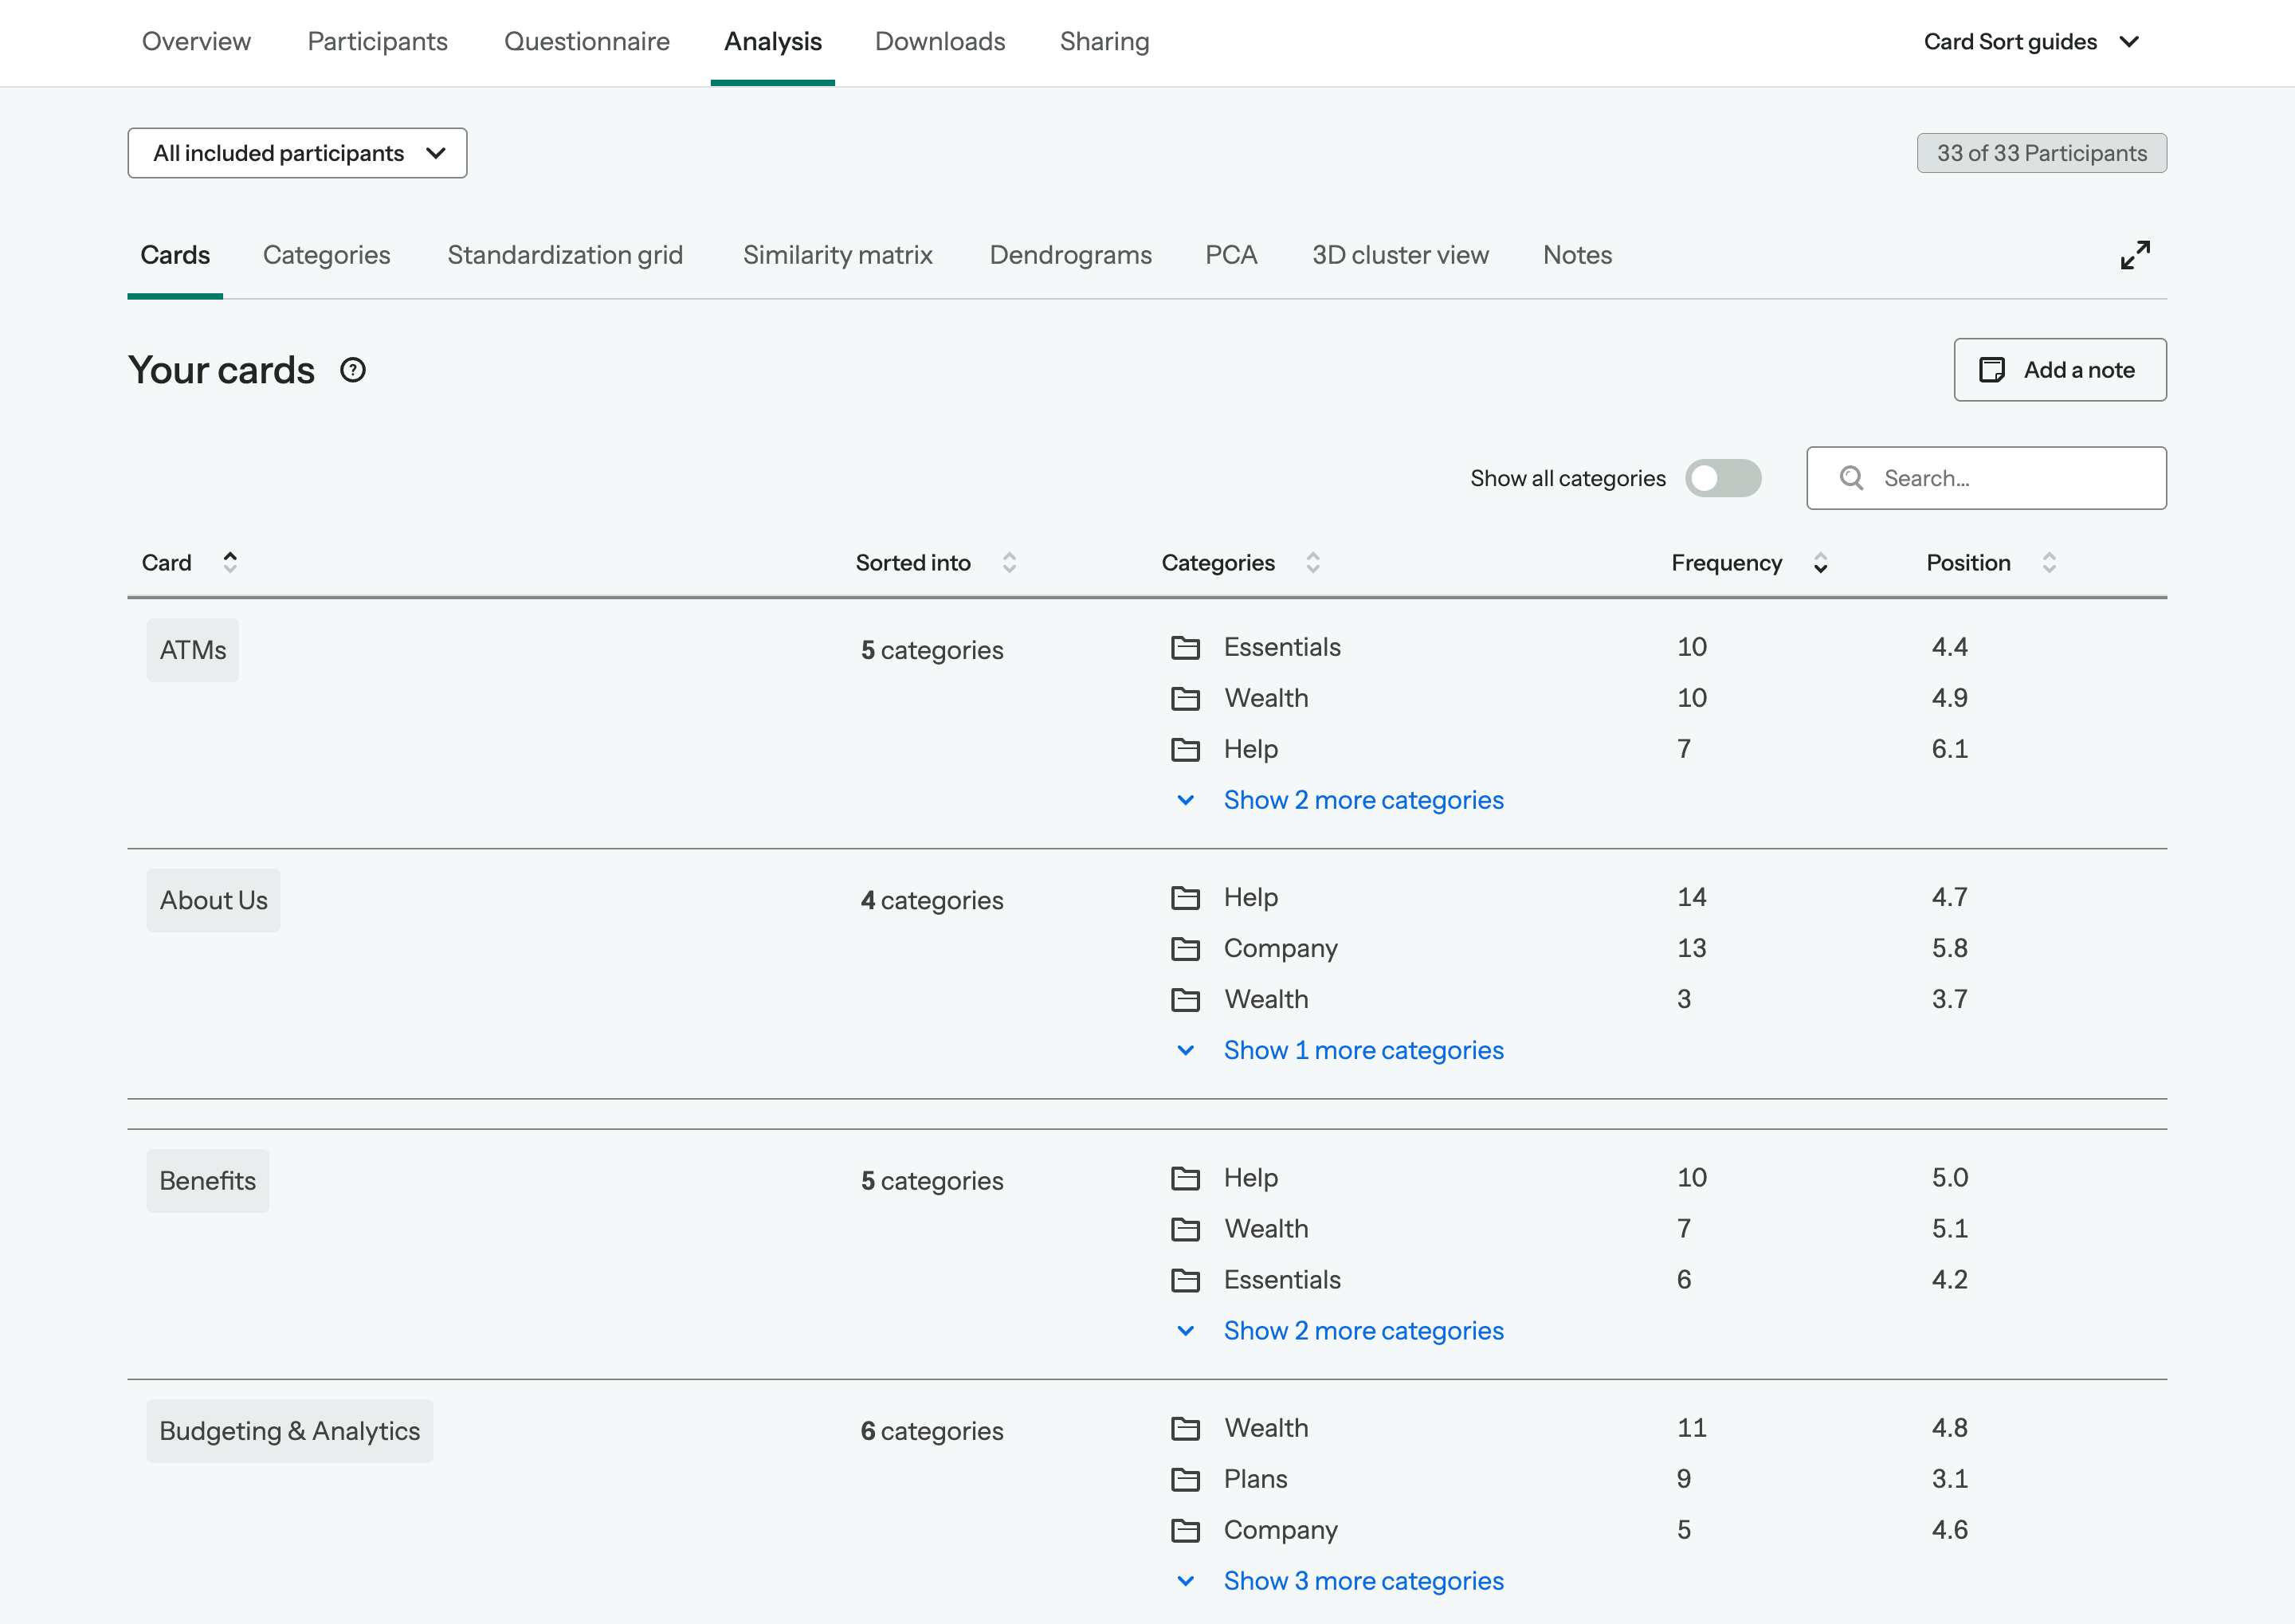
Looking at the Frequency column, you’ll get a clear idea of how many times each card was sorted into a particular category.